Optimization of heating wire arrangement in MOCVD on quadratic regression orthogonal rotational combination design
Abstract
Aluminum Gallium Nitride (AlGaN) and aluminum nitride (AlN) are key wide-band-gap III-nitrides for next-generation high-power, high-frequency, and deep-UV optoelectronics. However, the quality of epitaxial films is ultimately limited by the radial temperature uniformity of conventional vertical shower-head metal organic chemical vapor deposition (MOCVD) reactors. Here we conceptualize the resistive-heating wire as a continuous design space defined by wire width w (4.7–9.7 mm) and inter-wire gap g (1–6 mm). Under constant Joule-input power, a quadratic regression model with orthogonal-rotation design was employed to quantify the coefficient of variation (CV) of the deposition-wall temperature. Single-factor experiments showed that CV (w) initially falls, then rises, and finally falls again with increasing width, reflecting the balance between in-plane heat spreading and radiation from the 3.5 mm cold-strip, while CV (g) reaches a single minimum at approximately 3 mm. Analysis of Variance (ANOVA) at α = 0.25 identifies g and g² as the only significant factors (F > 1.57); w and interaction terms are statistically inert. A reduced second-order model in g alone predicts CV=0.0252 at the optimum combination of w = 7.2 mm and g = 3.14 mm. Confirmatory Computational Fluid Dynamics (CFD) with w = 7.2 mm and g = 3.14 mm yields CV = 0.0258, representing a relative error of less than 5%. The refined wire layout raises the mean wall temperature while suppressing lateral gradients, offering an immediately implementable retrofit for improved AlN growth without modifying shower-head geometry or operating recipes. The study delivers a regression-based design framework for resistive-heater optimization in vertical MOCVD reactors.
1. Introduction
AlGaN and AlN, as III-nitride semiconductor materials, possess a wide bandgap, strong polarization characteristics, and excellent chemical stability. These properties endow them with significant potential for applications in high-power, high-frequency electronic devices, high-temperature sensors, and optoelectronic devices. Consequently, they are critical foundational materials that underpin the advancement of next-generation electronics, optoelectronics, energy, and sensing technologies[1-3]. MOCVD stands as the predominant technique for synthesizing high quality AlGaN and AlN materials. Within this context, vertical shower-head reactors have garnered extensive adoption, primarily attributed to their remarkable efficiency and operational stability[4-6].
In real time reaction processes, temperature fluctuations can trigger distinct chemical responses. An et al.[7] recently conducted a comprehensive thermodynamic investigation into the gas phase chemical reaction mechanism of AlN during high temperature MOCVD Their study revealed that when the temperature exceeds 1000℃, MMAl, (MMAlNH)2, and (MMAlNH)3 emerge as the most probable final gaseous products, which are likely to serve as the primary precursors for subsequent surface reactions. Under such high-temperature conditions, the side reactions predominantly yield (DMAlNH2)2 and (DMAAlNH2)3, which readily decompose into smaller molecules. These smaller molecules are likely the precursors for the formation of AlN nanoparticles. Zhang et al.[8] further elucidated the most probable gas phase reaction pathways and their corresponding products in the trimethylaluminum (TMAl)/NH3/H2 system across different temperatures. Their analysis integrated both thermodynamic and kinetic perspectives, leveraging comparisons of Gibbs free energy changes between products and reactants, as well as Gibbs activation energies between transition states and reactants. Lin et al.[9] demonstrated that under constant-pressure conditions, the intensity of the orientation diffraction peak increases with rising growth temperature, while atomic force microscopy (AFM) measurements indicate a corresponding surface roughness decreases. During the heating process, spatial temperature variations within the reactor chamber can induce distinct chemical reaction conditions. These variations lead to the formation of different intermediate products and byproducts, ultimately resulting in reduced product yield and compromised uniformity of AlN film growth.
The geometric configuration of heating wires within a gas reaction chamber influences substrate temperature distribution and, consequently, the uniformity of gas heating within the chamber. Qu et al.[10] employed a resistance wire-heated MOCVD reaction chamber model to conduct thermal analysis and optimize reactor structure. Their findings revealed that the average temperature of the graphite heat absorber scales linearly with the vertical distance from the heater and is modulated by coil spacing. In a complementary study, Li et al.[11] investigated the thermal dynamics of their independently developed MB-600D MOCVD resistance heater. They demonstrated that increased heater surface emissivity enhances thermal radiation, thereby amplifying the heating effect on the graphite disk and raising overall temperature. Additionally, they established a direct correlation between the rotational speed of graphite disk and the uniformity of temperature distribution on its top surface, ultimately determining the optimal vertical spacing between the disk and the heater. Zuo et al.[12] introduced a cost-efficient face-to-face heating mist-CVD apparatus for growing α-Ga2O3 thin films on cubic sapphire substrates. Despite slightly lower film quality compared to conventional methods, their approach significantly reduced production costs, highlighting its potential for scalable applications. Collectively, these studies emphasize the critical role of optimizing heating wire geometry to enhance temperature field uniformity and stability within the reaction chamber, thereby improving the growth quality of AlN films. In this study, we systematically examines the impact of the heating wire configuration on the temperature distribution within the reactor chamber from a single-factor perspective. Subsequently, a comprehensive analysis of multifactorial effects were conducted using the quadratic regression orthogonal rotation combination method to optimize the arrangement of heating wires.
2. Models
2.1. Geometric model
The MOCVD reactor investigated in this study is a premixed shower-head type, with its fundamental geometric structure depicted in Figure 1(a). The Group III metal organic source, TMAl, and the Group V nitrogen source, NH₃, are introduced into the mixing chamber via hydrogen (H₂) as the carrier gas. These precursors undergo gas phase reactions within the reactor. The reaction intermediates, which serve as the precursors for thin-film growth, subsequently diffuse to the substrate surface maintained at an elevated temperature. The AlN thin film is grown on a sapphire substrate, while unreacted gases and reaction products are exhausted through two outlets. The heating wire, which provides the thermal energy for the reaction, transfers heat to the entire reactor chamber through the deposition surface. The structure of the heating wire is shown in Figure 1(b). This work examines the effects of the heating wire width (w) and spacing (g) on the heating within the reactor chamber, with w ranging from 4.7 mm to 9.7 mm and g ranging from 1 mm to 6 mm.
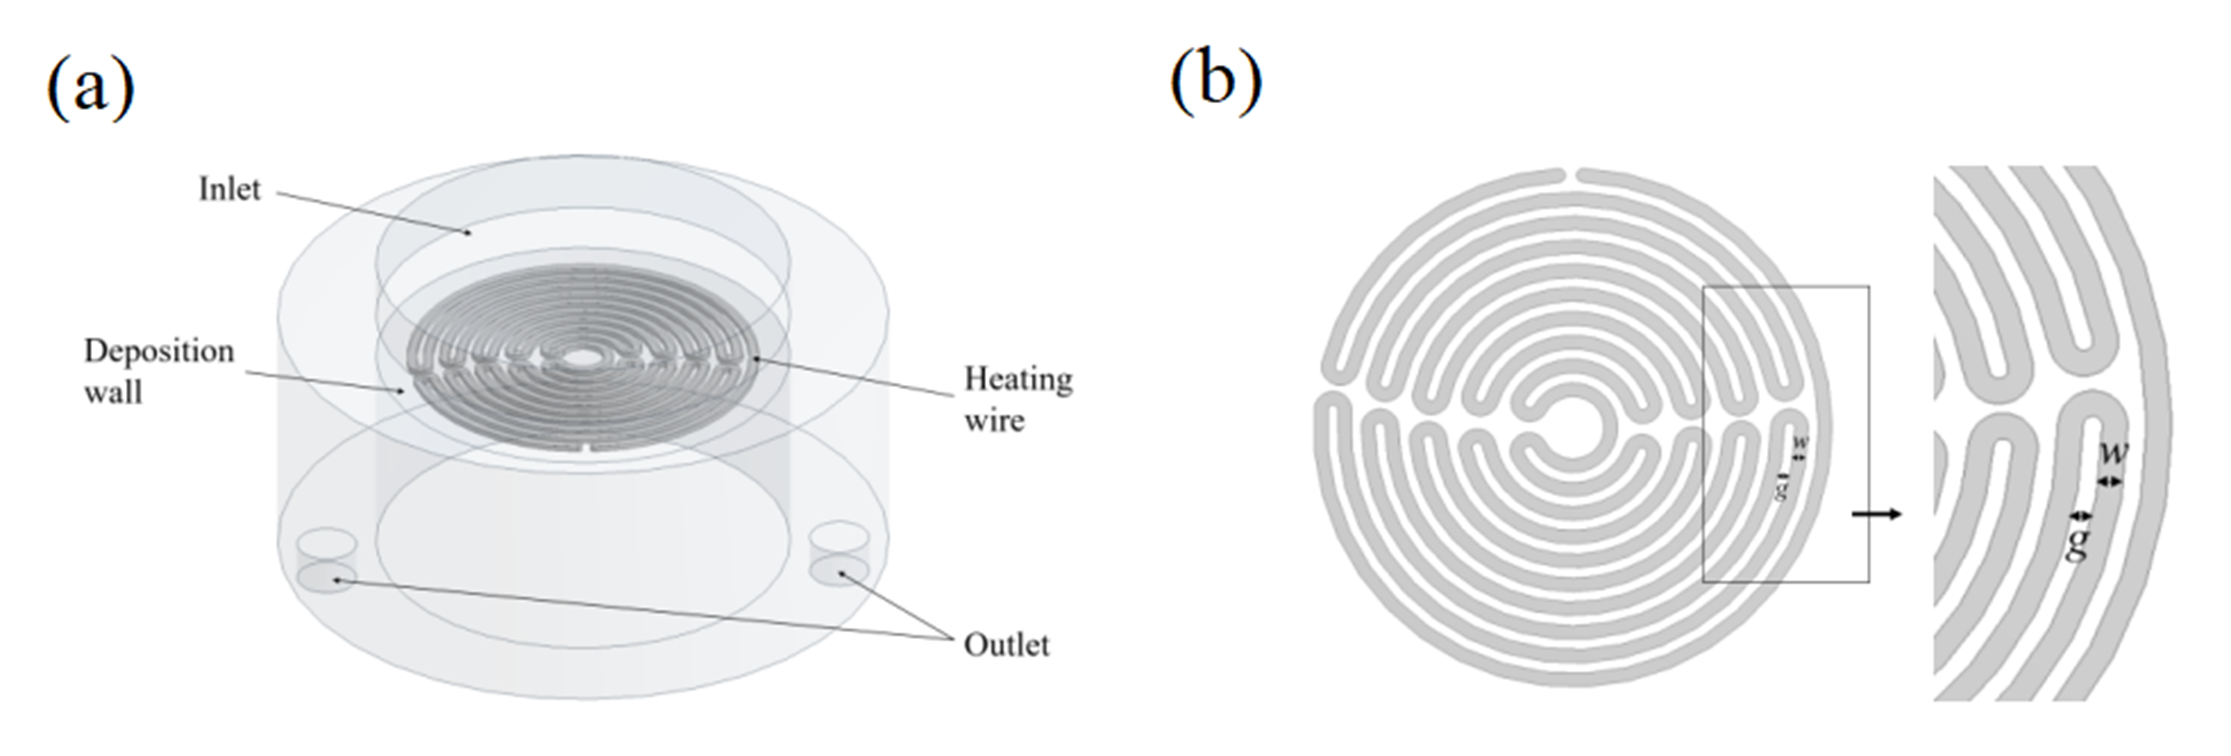
Figure 1. (a) Geometric Diagram. (b) Structure of the heating wire and its zoom view.
2.2. Mathematical Model
The mathematical model for fluid flow and heat transfer in MOCVD consists of a set of coupled partial differential equations[13], including the continuity equation
the momentum equation
the energy equation
the species equation
and the equation of state
where $\rho$ is the density, $u_{i}$ is the velocity vector component, $g_{i}$ is the gravitational acceleration vector, $p$ is the pressure, $\mu$ is the viscosity, $T$ is the temperature, $p_{b}$ is environmental pressure, $p_{b} = 1.0135 \times 10^{5} \text{ Pa}$, $M_{s}$ is the molar mass of the $s$-th component, $Y_{s}$ is the mass fraction of the $s$-th component, $R$ is the gas constant, $\dot{q}$ and $\dot{b}$ are the heat and mass source term, and the Schmidt number $Sc$ and the Prandtl number $Pr$ are $Sc = Pr = 0.70$.
Numerical simulations are employed to conduct virtual experiments. The CFD simulation is set as follows: A pressure-based solver is utilized and configured for steady-state conditions. Given the presence of heat transfer during the simulation process, the energy equation was activated. The standard k-ε turbulence model was selected to account for turbulent flow characteristics. The inlet boundary condition is specified as a mass flow rate inlet of 3×10⁻⁵ kg/s, with H2 as the inlet gas, flowing perpendicularly to the inlet surface. The outlet boundary is set as a pressure outlet. The operating pressure is maintained at 10000 Pa. A solid heating wire serves as the heat source with a heating power of 105 W/m3. This heat source is coupled with the fluid flow to heat the deposition surface through conjugate heat transfer. Subsequently, the entire reaction chamber is heated via radiative and convective heat transfer mechanisms. A convective heat-transfer boundary condition was imposed on the all remaining walls. The heat-transfer coefficient, h = 300W/(m²·K), and the free-stream temperature, T∞ = 323 K, were taken directly from measurements on the production-scale reactor, ensuring that the simulation reproduces the actual thermal losses experienced by the hardware.
3. Results and Analysis
Coefficient of variation (CV) is a pivotal dimensionless statistic for quantifying relative dispersion. It is defined as the ratio of the sample standard deviation to the sample mean, thereby normalizing the spread of the data with respect to its central tendency. Mathematically,
where $\overline{x} = \frac{1}{n}\sum_{i = 1}^{n}x_{i}$ denotes the arithmetic mean of the observed values $\{x_{1}, x_{2}, x_{3}, \dots, x_{n}\}$, and $s = \sqrt{\frac{1}{n - 1}\sum_{i = 1}^{n}\left( x_{i} - \overline{x} \right)^{2}}$ is the sample standard deviation, which measures the average deviation of individual observations from the mean.
Deposition wall functions as the primary locus for surface-mediated reactions. While, its thermal homogeneity directly governs the local growth kinetics of AlN, thereby dictating the spatial uniformity of the AlN film. Within this investigation, temperature uniformity across the deposition wall is quantified through its CV. Under invariant Joule-input power, deliberate modulation of the resistive heater’s linewidth w and inter-line gap g enables deterministic tailoring of the wall-temperature field, affording prescribed degrees of thermal uniformity. The following sections provide a parametric analysis of how these geometric variables influence the CV of the deposition wall.
3.1. Univariate Analysis
Figure 2 depicts the CV of the Deposition wall temperature as a function of w (4.7–9.7 mm) at a constant g = 3.5 mm and fixed input power. CV exhibits a non-monotonic “drop–rebound–drop” profile: CV initially decreases from 0.037 at w = 4.7 mm to a local minimum of 0.027 at w = 6.2mm, surges to the scan maximum of 0.050 at w = 7.7 mm, and finally recedes to the global minimum of 0.028 at w = 9.7 mm. This non-monotonic signature is governed by the competition between the expanding heated-area fraction φ = w/(w + 3.5 mm) and the invariant 3.5 mm cold strip. Between 4.7 mm and 6.2 mm the rising φ (from 0.57 to 0.64) dilutes the relative influence of the strip and flattens the temperature field. From 6.2 mm to 7.7 mm, the thermal diffusion length becomes comparable to the strip width, anchoring a persistent cool band that enlarges the lateral temperature spread and drives CV to its peak. Beyond 7.7 mm, lateral conduction spans the strip, re-homogenises the surface, and pushes CV to its lowest recorded value. Thus, without any adjustment of input power or gap geometry, the optimum thermal uniformity is achieved at the largest scanned width, w ≈ 9.7 mm.
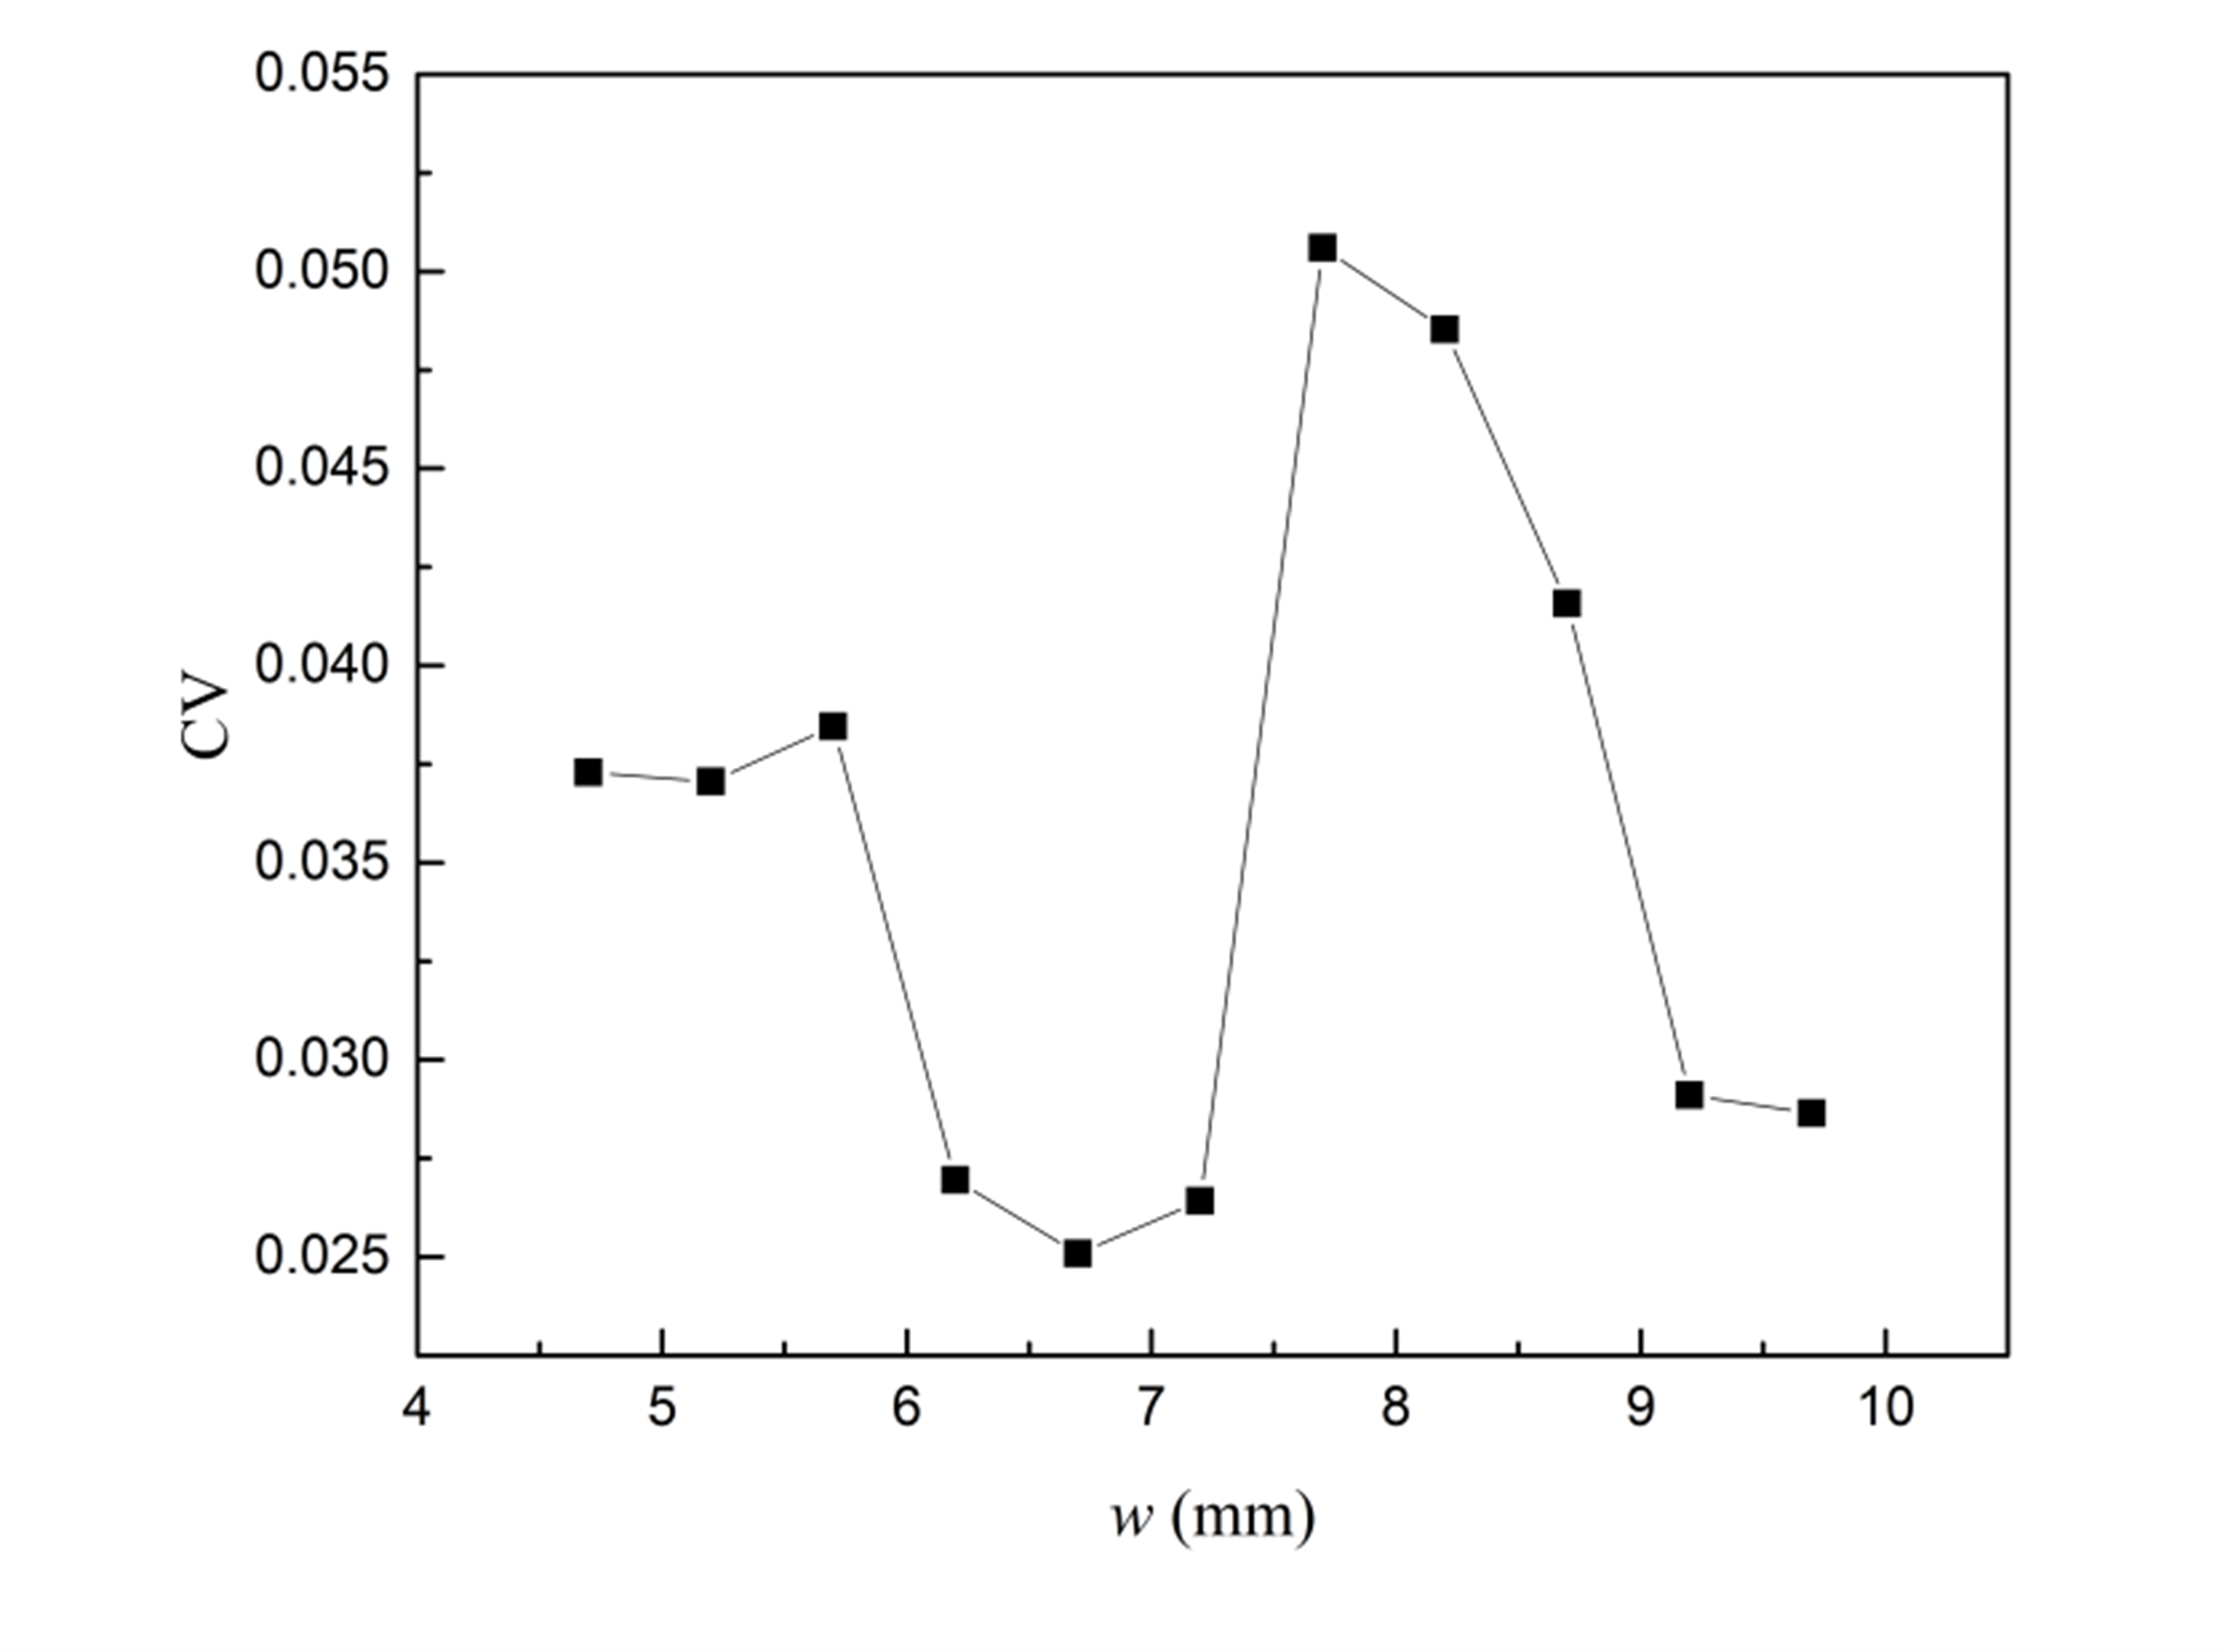
Figure 2. Relationship between CV and width.
Figure 3 quantifies the CV of the deposition wall temperature as the g is increased from 1 mm to 6 mm, while the width is fixed at w = 7.2 mm and the total Joule power remains constant. The plotted curve reveal a shallow-V profile: CV first decreases from 0.030 (g = 1 mm) to a minimum of 0.026 at g ≈ 3 mm, and then rises steadily to 0.045 at g = 6 mm. This behaviour is governed by the competition between heated-area fraction φ = w/(w+g) and the fixed-power budget. Between 1 mm and 3 mm, the pitch expands only modestly (from 8.2 mm to10.2 mm), consequently, φ declines from 0.88 to 0.71, and the areal heat load falls by <15%. The narrow gaps (<3 mm) are easily bridged by lateral conduction, so the peak-to-valley wall temperature difference ΔT shrinks and CV drops. Beyond 3 mm, the uncovered wall fraction increases rapidly (from φ = 0.71 to 0.55). The 3.5–6 mm cold strips act as high-view-factor radiation sinks, and the unheated surface temperature falls while the temperature beneath the 7.2 mm heater remains almost unchanged; ΔT consequently doubles, driving CV back to the scan maximum. Thus, for w = 7.2 mm under invariant input power, the optimum thermal uniformity (minimum CV ≈ 0.026) is obtained at g ≈ 3 mm, whereas wider gaps inevitably degrade temperature homogeneity.
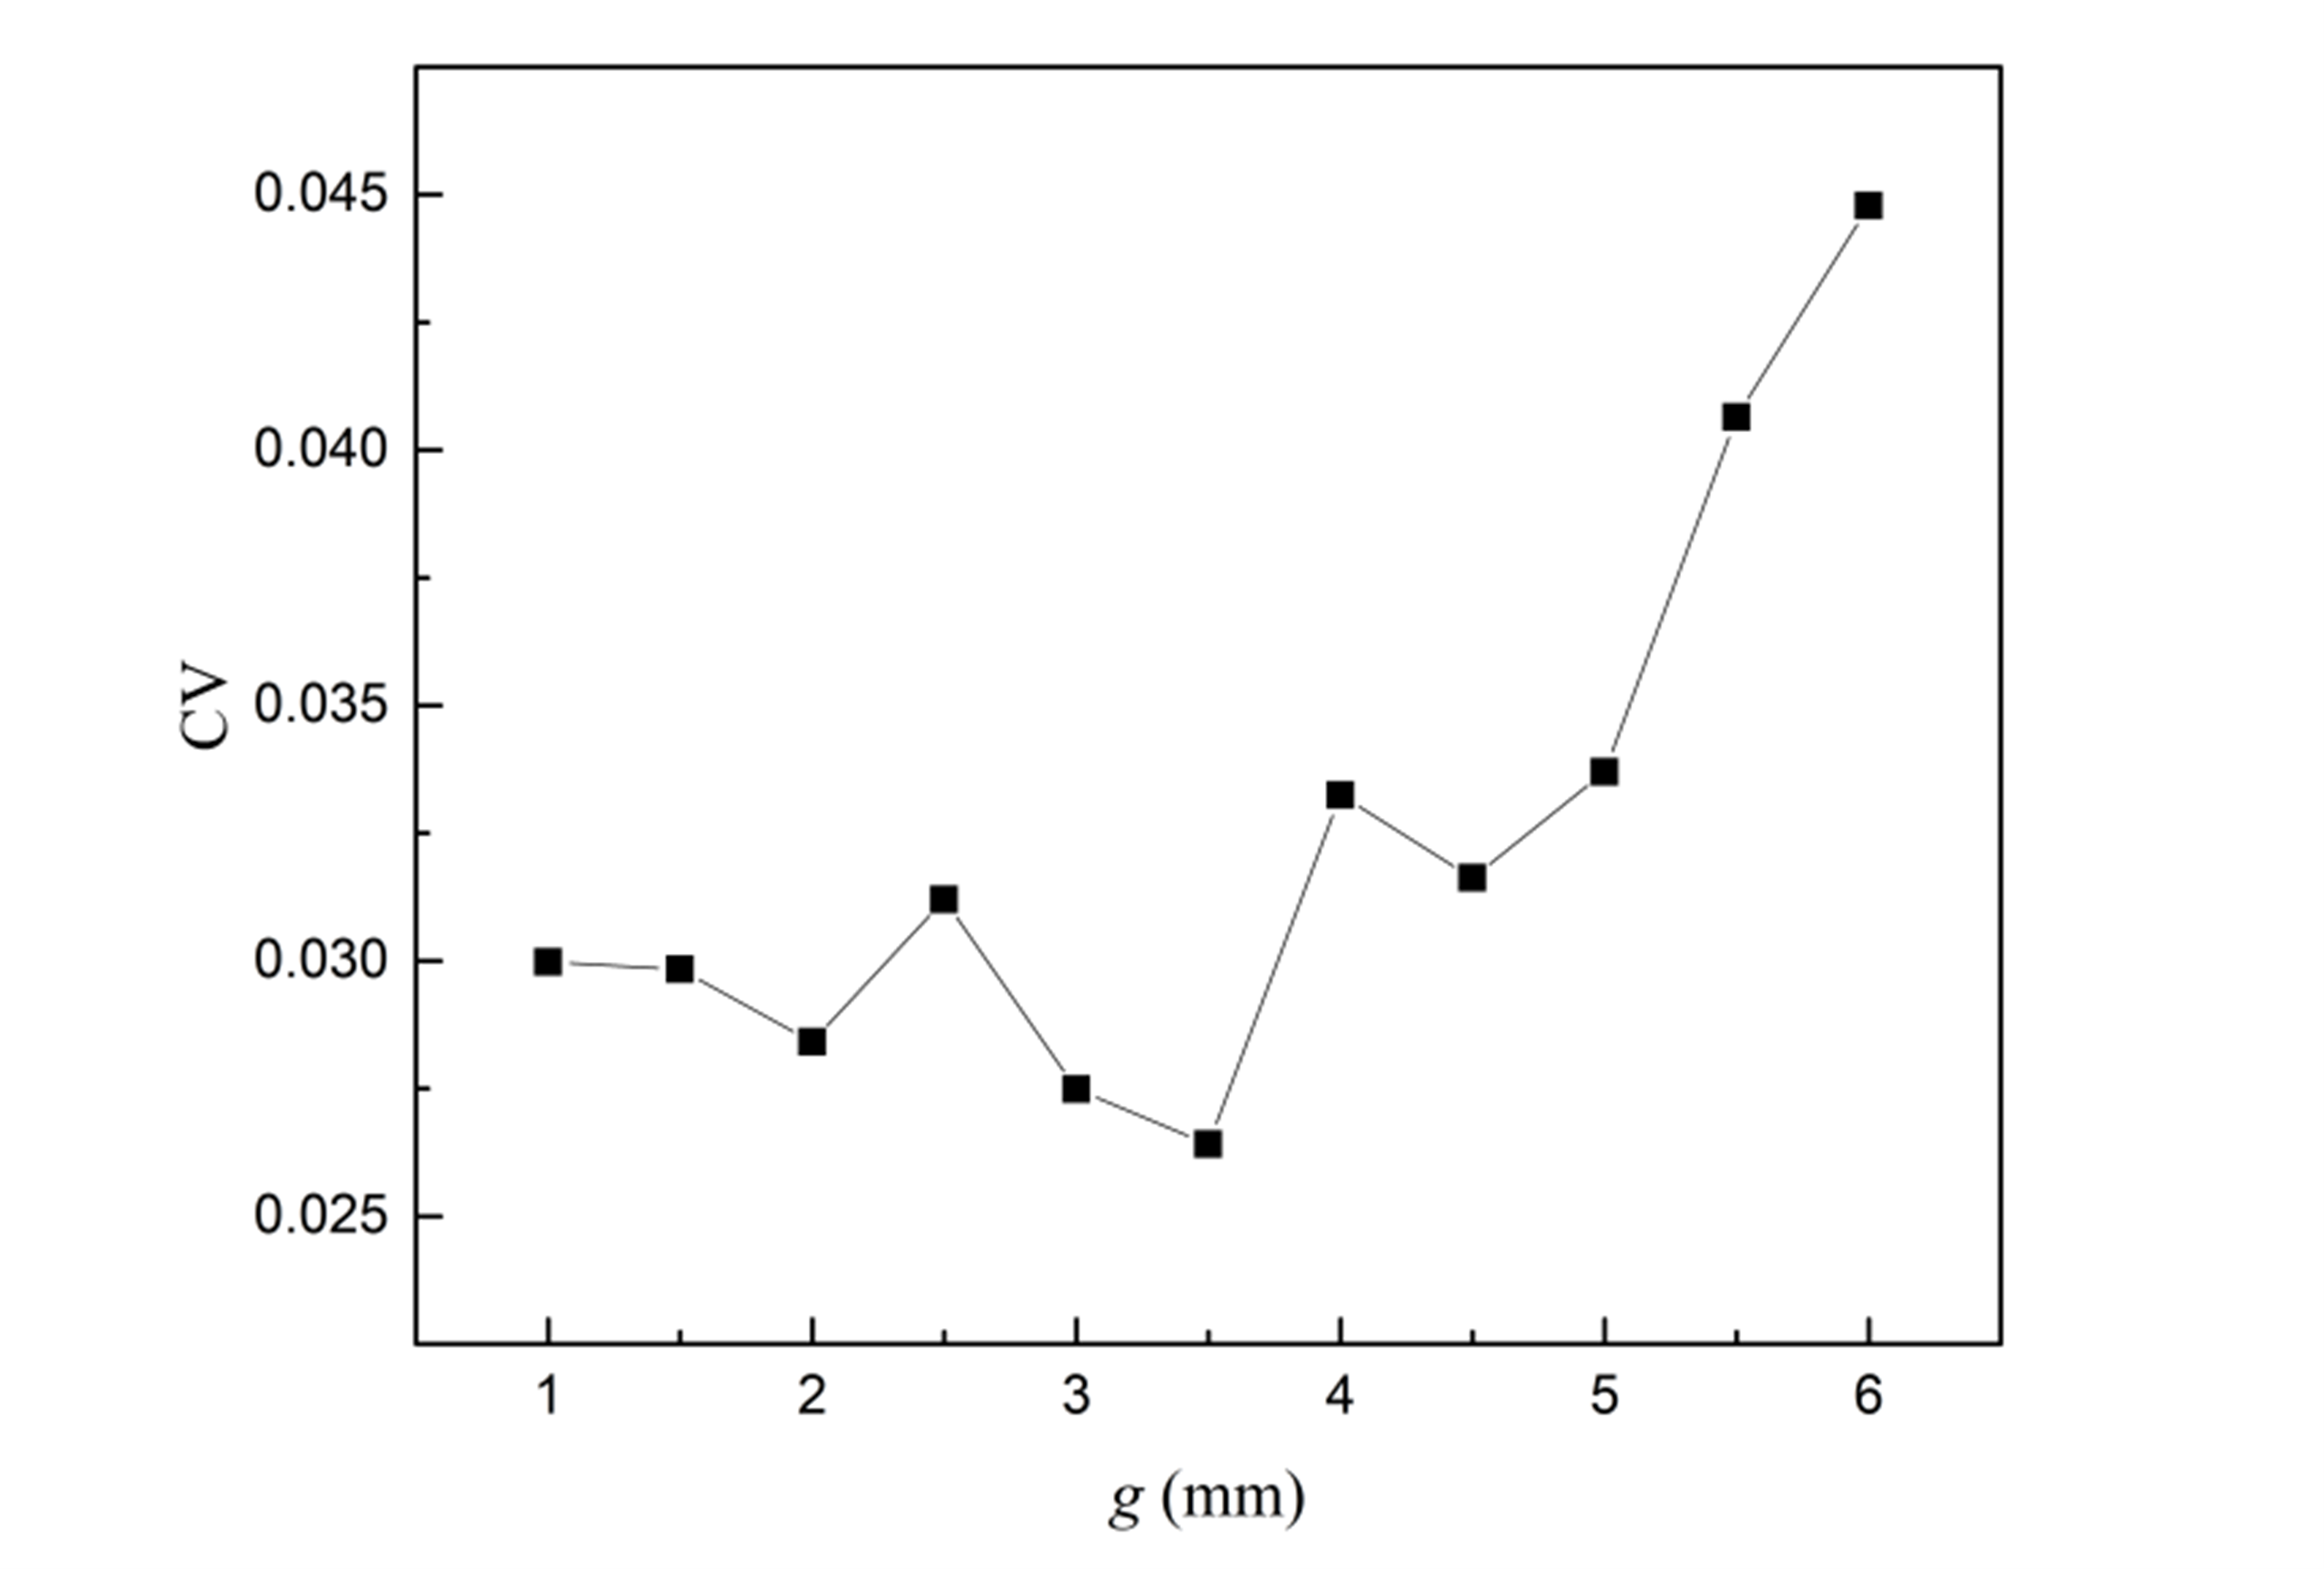
Figure 3. Relationship between CV and gap.
3.2. Results of Quadratic Regression Orthogonal Rotation Combination Experiment
Based on the analysis of heating wire width w and gap g, a quadratic regression orthogonal rotation combination design was employed to identify the optimal heating wire arrangement scheme, accounting for various factors and their interactions[14,15]. Each factor was subsequently discretised into five levels and embedded in an quadratic regression orthogonal rotation combination experiment. The design matrix comprised 13 experimental runs: four 2² factorial points, four axial (star) points, and five centre-point replicates. To ensure orthogonality, the star-arm distance γ was set to 1.2671. Original process variables zj were linearly transformed into dimensionless coded variables xj via the coding equation,
where $z_{j0}$ denotes the centre level, $\Delta j$ is the step size, $z_{j\gamma}$ and $z_{-j\gamma}$ represent the upper (lower) axial level imposed by $\gamma$. This dimensionless transformation converts the regression problem into a normalized hyperspace, thereby simplifying coefficient estimation and enhancing numerical conditioning. With the reaction CV of the deposition wall temperature serving as the response value, the experimental factors and level design are presented in Table 1.
Table 1. Coded levels for independent variables
| code | z1 | z2 |
|---|---|---|
| w | g | |
| 1.2671 | 9.7 | 6 |
| 1 | 9.173 | 5.473 |
| 0 | 7.2 | 3.5 |
| -1 | 5.227 | 1.527 |
| -1.2671 | 4.7 | 1 |
The experiment scheme and results are shown in Table 2. Based on the data analysis, a regression model was constructed for the two factors x1 and x2. This model enabled the determination of the constant term, interaction term, and quadratic term coefficients. The calculated regression coefficients were subsequently utilized to formulate the regression fitting equation for the average temperature of the reaction chamber y, as depicted in Equation (8).
Table 2 . Quadratic regression orthogonal rotation combination design with experimental results
| Number | x1 | x2 | y |
|---|---|---|---|
| 1 | 1 | 1 | 0.035279 |
| 2 | 1 | -1 | 0.029546 |
| 3 | -1 | 1 | 0.02542 |
| 4 | -1 | -1 | 0.028322 |
| 5 | 1.2671 | 0 | 0.029171 |
| 6 | -1.2671 | 0 | 0.037743 |
| 7 | 0 | 1.2671 | 0.044785 |
| 8 | 0 | -1.2671 | 0.029981 |
| 9 | 0 | 0 | 0.026413 |
| 10 | 0 | 0 | 0.026411 |
| 11 | 0 | 0 | 0.026416 |
| 12 | 0 | 0 | 0.026418 |
| 13 | 0 | 0 | 0.026414 |
At a relaxed significance level of α = 0.25 (critical F = 1.57), the ANOVA in Table 3 indicates that x1 is statistically inert (F = 2.17×10⁻⁴ ≪ 1.57). Therefore, further fine-tuning of w around 7.2 mm will not measurably alter CV. In contrast, x2 is significant (F = 2.07 > 1.57), confirming that varying g alone is sufficient to modulate uniformity within the 1–6 mm window. The width–gap interaction (x1x2, F = 0.60) is negligible, validating the one-factor-at-a-time protocol employed. Meanwhile, the quadratic term in g (F = 3.51) exceeds the threshold, statistically supporting the second-order fit and the existence of an optimal gap. Although the overall regression F ≈ 1.07 remains below 1.57, the two significant terms (g and g²) capture the bulk of explainable variance. Consequently, a reduced second-order model in g alone is recommended for future interpolation. This conclusion aligns with the experimental observation that CV is minimized at g ≈ 3 mm without any adjustment of width or input power.
Table 3. Variance analysis results of regression model using protease activity as evaluation index
| Sources of Variation | Sum of Squares | Degrees of freedom | Mean square | F-value |
|---|---|---|---|---|
| x1 | 6.80×10⁻⁹ | 1 | 6.80×10⁻⁹ | 2.17×10⁻⁴ |
| x2 | 6.46×10⁻⁵ | 1 | 6.46×10⁻⁵ | 2.07 |
| x1x2 | 1.86×10⁻⁵ | 1 | 1.86×10⁻⁵ | 0.596 |
| x12 | 2.42×10⁻⁵ | 1 | 2.42×10⁻⁵ | 0.773 |
| x22 | 1.10×10⁻⁴ | 1 | 1.10×10⁻⁴ | 3.51 |
| Regression | 2.17×10⁻⁴ | 5 | 3.34×10⁻⁵ | |
| Residual | 2.19×10⁻⁴ | 7 | 3.12×10⁻⁵ | |
| Lack of fit | 2.19×10⁻⁴ | 3 | 7.29×10⁻⁵ | |
| Error | 8.80×10⁻¹² | 4 | 2.20×10⁻¹² | |
| Total | 4.38×10⁻⁴ | 12 | 3.65×10⁻⁵ |
After excluding terms with F-values below the 1.57 threshold (Table 3), the reduced model (derived from the significant coefficients of regression equation (8)) is condensed into the final predictive form given as equation (9)
The restored regression equation is as follows
The average temperature y serves as an indicator of the heating wire's thermal uniformity and is the objective of this experiment. A higher average temperature y corresponds to a more effective heating performance of the heating wire. To achieve the optimal combination of factors under given constraints, the objective function and constraints are detailed in Equation (10)
Targeting a minimum CV, the optimization procedure returned a heater width of 7.2 mm and a gap of 3.14 mm, for which the model predicts CV = 0.0252. Rerunning the case with w = 7.2 mm and g = 3.14 mm gave CV = 0.0258, a difference below 5%. This agreement confirms the reliability of the local search procedure and provides a straightforward route for further refinement of wire layouts.
4. Conclusion
The uniform growth of high-quality AlN and AlGaN films by MOCVD is critically dependent on precise temperature control within the reaction chamber. This study systematically investigates the influence of resistive heater geometry, specifically, the wire width (w) and inter-wire gap (g), on the temperature uniformity across the deposition surface, quantified by the CV of the wall temperature. By employing a combined approach of univariate analysis and a quadratic regression orthogonal rotation combination design, we elucidate the individual and interactive effects of w (4.7–9.7 mm) and g (1–6 mm). Univariate results reveal a non-monotonic relationship between CV and w, governed by the competition between heated-area fraction and lateral thermal conduction. For g, a shallow-V profile emerges, with optimal uniformity (minimum CV) achieved near 3 mm for a fixed w of 7.2 mm. The regression model, derived from a designed matrix of 13 experiments, confirms that g is a statistically significant factor affecting temperature uniformity, whereas the effect of w and the interaction term are negligible within the studied ranges. The model yields an optimized configuration of w = 7.2 mm and g = 3.14 mm, predicting a minimum CV of 0.0252. A subsequent CFD simulation at these parameters produces a CV of 0.0258, validating the model's predictive accuracy with an error below 5%.
This work demonstrates a robust, simulation-guided methodology for optimizing heater layout in shower-head MOCVD reactors. The identified geometry directly enhances thermal homogeneity on the deposition surface, a prerequisite for improving the thickness and compositional uniformity of grown AlN films, thereby contributing to the advancement of high-performance nitride semiconductor devices.
Author Contributions
Chao Li did the work of calculation, model construction and writing, Hui Li did the work of model construction, Fan Zhang did the work of investigation and writing, Kailei Wang did the work of calculation.
Acknowledgements
This project is supported by the "Challenge and Response" program of the Major Science and Technology Special Project of Shanxi Province (202201030201008), the Science and Technology Innovation Project of Shanxi Higher Education Institutions (2023L331), and the Innovation and Entrepreneurship Training Program for College Students of Shanxi Higher Education Institutions (019/XN0255).”
Conflicts of Interest
The authors declare that the research was conducted in the absence of any commercial or financial relationships that could be construed as a potential conflict of interest.
Reference
[1] L. Y. Wang, J. H. Cheng, K. Qu, Q. F. Zhu, B. B. Tian, Z. Z. Yang. “Aluminum-Nitride-Based Semiconductors: Growth Processes, Ferroelectric Properties, and Performance Enhancements.” Inorganics. 2025, 13, 2, 29.
[2] X. W. Liu, A. W. Bruch, H. X. Tang. “Aluminum nitride photonic integrated circuits: From piezo-optomechanics to nonlinear optics.” Adv. Opt. Photonics. 2023, 15, 1, 236-317.
[3] R. X. Yu, G. X. Liu, G. D. Wang, C. M. Chen, M. S. Xu, H. Zhou, T. L. Wang, J. X. Yu, G. Zhao, L. Zhang. “Ultrawide-bandgap semiconductor AlN crystals: growth and applications.” J. Mater Chem C. 2021, 9, 6, 1852.
[4] S. Hagedorn, A. Knauer, F. Brunner, A. Mogilatenko, U. Zeimer, M. Weyers. “High-quality AlN grown on a thermally decomposed sapphire surface.” J. Cryst Growth. 2017, 479, 3, 16.
[5] Z. Q. Lu , Y. N. Wang, L. H. Wang, Y. Xu, Y. H. Liu, K. Xu. “Nucleation study of AlN crystal growth on 6H-SiC substrates using the MOCVD.” Appl. Phys. Lett. 2024, 125, 242101.
[6] S. Hasan, M. U. Jewel, S. G. Karakalos , M. Gaevski, I. Ahmad. “Comparative Spectroscopic Study of Aluminum Nitride Grown by MOCVD in H2 and N2 Reaction Environment.” Coatings. 2022, 12, 7, 924.
[7] J. An, X. Y. Dai, Q. Zhang, R. Q. Guo, L. S. Feng. “Gas-Phase Chemical Reaction Mechanism in the Growth of AlN during High-Temperature MOCVD: A Thermodynamic Study.” ACS Omega. 2022, 5, 20, 11792-11798.
[8] H. Zhang, R. Zuo, T. T. Zhong, L. Zhang. “Quantum Chemistry Study on Gas Reaction Mechanism in AlN MOVPE Growth.” J. Phys. Chem. A. 2020, 124, 15, 2961.
[9] B. H. Lin, Y. Cai , Y. X. Wang, Y. Zou, C. Gao, Y. Liu, W. J. Liu, S. H. Guo, C. L. Sun. “Effects of growth temperature and reactor pressure on AlN thin film grown by metal-organic chemical vapor deposition.” Thin Solid Films. 2023, 783, 140037.
[10] Y. X. Qu, B. Wang, S. G. Hu, X. F. Wu, Z. M. Li, Z. J.Tang, J. Li, Y. I. Hu. “Analysis and design of resistance-wire heater in MOCVD reactor.” J. Cent. South. Univ. 2014, 21, 9, 3518-3524.
[11] J. Li, T. C. Luo, H. T. Wen, J. J. Deng, M. Y. Wu, Y. Li, G. Wang, Y. L. Pei. “Design and regularity research of MOCVD heating plate based on experiments and simulations.” Vacuum. 2020, 174, 5, 109174.
[12] Y. Zuo, Q. Feng, T. Zhang, X. S. Tian, W. J. Li, J. I. Li, C. F. Zhang, J. C. Zhang, Y. Hao. “A Novel Method for Growing α-Ga2O3 Films Using Mist-CVD Face-to-face Heating Plates .” Nanomaterials. 2023, 13, 1, 72.
[13] Y. K. Yang, L. H. Gao, H. X. Chen, S. Fu. “CFDnumerical simulation and optimization of GaN-mocvd reactor .” Engineering Mechanics. 2007, 24, 9, 173.
[14] W. Yuan, L. Tang, S. He. “Effectiveness ofmagnetic flocculation process in treating river water under thedesign of secondary rotating combination.” China Water and Wastewater. 2021, 37, 3, 92.
[15] H. Zheng, Y. Ma, J. Xie. “Energyconsumption optimization of RSV ethane recovery processbased on regression orthogonal experimental design.” Energy Conservation and Measurement in Petroleum and Petrochemical Industry. 2023, 13, 10, 36.