Ratio of red blood cell distribution width to platelet count as a novel parameter to predict mortality in patients with acute respiratory distress syndrome
published: 15 May 2025 | https://doi.org/10.63174/xdi.ZCVR6230
Abstract
An excessive inflammatory response and coagulation disorder promote the occurrence and development acute respiratory distress syndrome (ARDS). The ratio of the red blood cell distribution width to the platelet count (RPR) is a novel predictor of mortality in patients with ARDS. The purpose of this study was to determine the association between RPR and all-cause mortality in patients with ARDS. This study analyzed data obtained from the Medical Information Mart for Intensive Care-III database. The clinical endpoint was 28-day mortality. Restricted cubic splines were used to determine the relationship between RPR and 28-day mortality. A Cox proportional-hazards model and subgroup analysis were used to determine the association between RPR tertiles and 28-day all-cause mortality. The 3742 included patients comprised 1128, 1384, and 1230 in the low-RPR (RPR ≤0.05), moderate-RPR (RPR >0.05 and ≤0.08), and high-RPR (RPR >0.08) groups, respectively. The mean age of the patients was 61.00 years (age range=49.00–73.00 years). Dose–response analysis indicated a V-shaped curve (nonlinear p<0.0001) between RPR and 28-day mortality in patients with ARDS. The high-RPR group had a higher mortality risk (hazard ratio=1.432, 95% confidence interval=1.176–1.743, p<0.001). The subgroup analysis indicated that RPR did not interact with other factors in the 28-day mortality of patients with ARDS. These results indicated that RPR, as a convenient laboratory parameter, is of great value in evaluating the prognosis of patients with ARDS. Higher RPR is associated with increased mortality.
1. Introduction
As a result of a variety of intrapulmonary or extrapulmonary factors, acute respiratory distress syndrome (ARDS) causes a diffuse inflammatory lung injury in the lungs[1]. An excessive inflammatory response plays a decisive role in ARDS pathogenesis, leading to pulmonary endothelial cell injury, and increases in capillary permeability and diffuse pulmonary edema, resulting in reduction of the effective pulmonary ventilation area[2]. Despite many efforts, there is still no treatment method targeting the ARDS pathogenesis, and its mortality rate is still as high as 40%[3]. At present, diagnosis and treatment of infection, respiratory support, fluid management, and general support are all important aspects of ARDS management[2]. It is therefore necessary to identify a biomarker that can expediently and reliably forecast the prognoses of patients with ARDS.
The red blood cell distribution width (RDW) is an index that judges the volume difference of red blood cells (RBCs) in peripheral blood, and is often used to identify anemia in clinical practice[4]. RDW has high predictive value in many inflammatory-response-related diseases, including sepsis[5], acute pancreatitis[6], acute kidney injury[7], and COVID-19[8]. Increased RDW may be related to increased mortality in patients with ARDS[9]. Platelets are biologically active small clumps that break off the cytoplasm of bone marrow megakaryocytes[10]. As a common intersection between inflammatory response, coagulation cascade, and endothelial cells, platelets seem to be an attractive mediator and possible therapeutic target in ARDS[11]. RDW and the platelet count are important parameters in the circulatory system pathophysiology, and are both related to inflammatory response, and their changes can affect each other. Hence, the RDW-to-platelet ratio (RPR) has recently been found to be associated with the prognosis of diversified diseases, including neonatal sepsis[12], strokes[13], acute pancreatitis[14], and breast cancer.[15]. However, no study has shown its relationship with the prognosis of patients with ARDS. We therefore investigated the relationship between RPR and the prognosis of patients with ARDS within 24 hours of intensive care unit (ICU) admission. Recent studies have demonstrated the prognostic utility of RPR in a variety of conditions, including cardiovascular diseases (e.g., myocardial infarction, heart failure), infections (e.g., neonatal sepsis, bacteremia), and malignancies. These findings support RPR as a generalizable biomarker reflecting systemic inflammation and coagulopathy and provide a rationale for its investigation in ARDS.
2. Results
2.1 Population and Baseline Characteristics
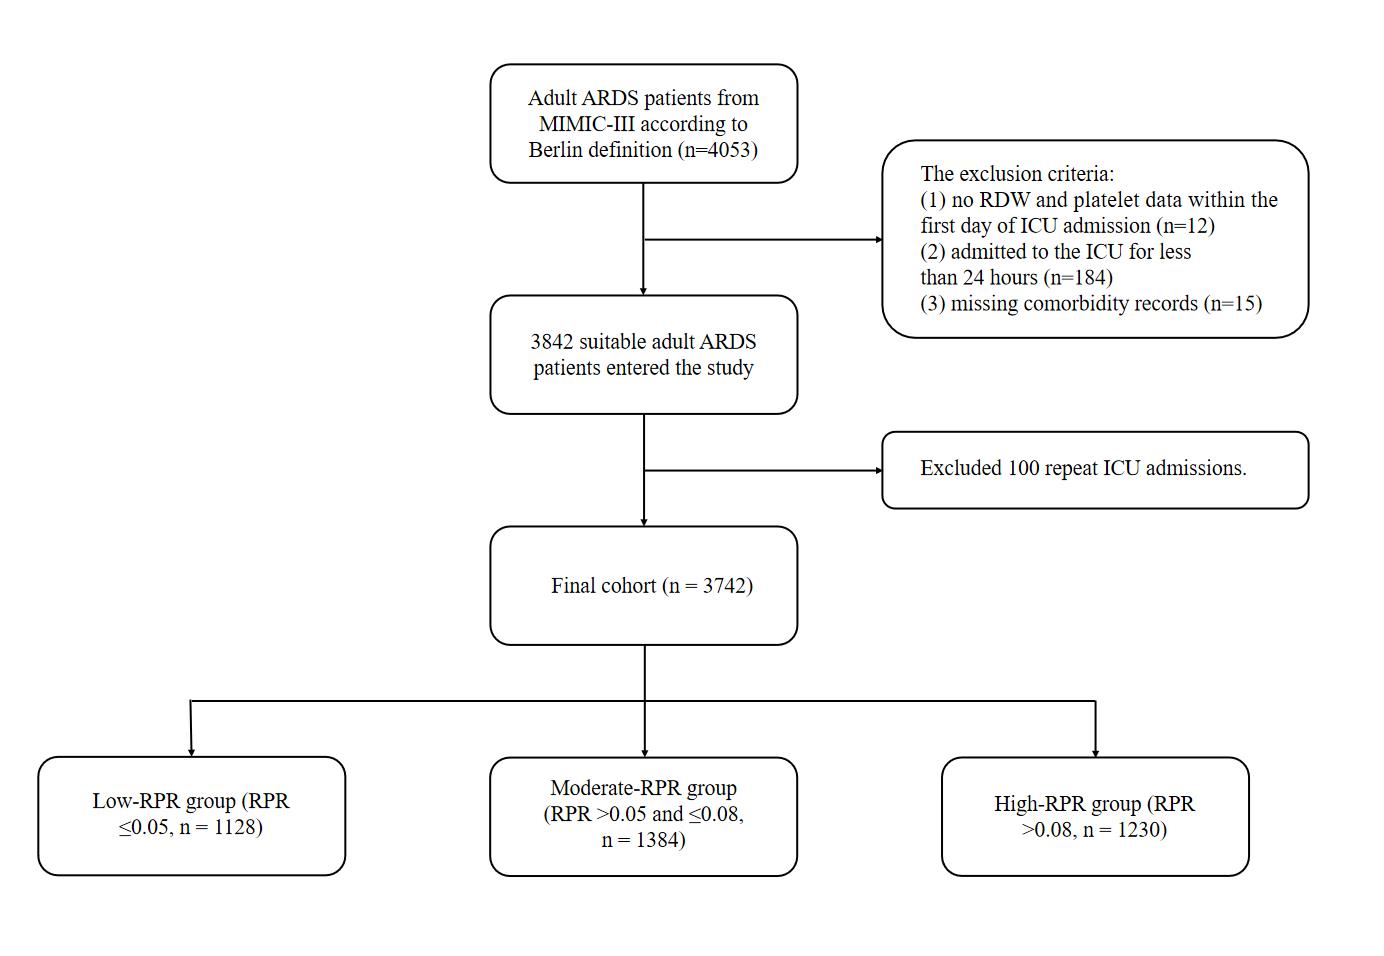
Figure 1 Flow chart for study participants.
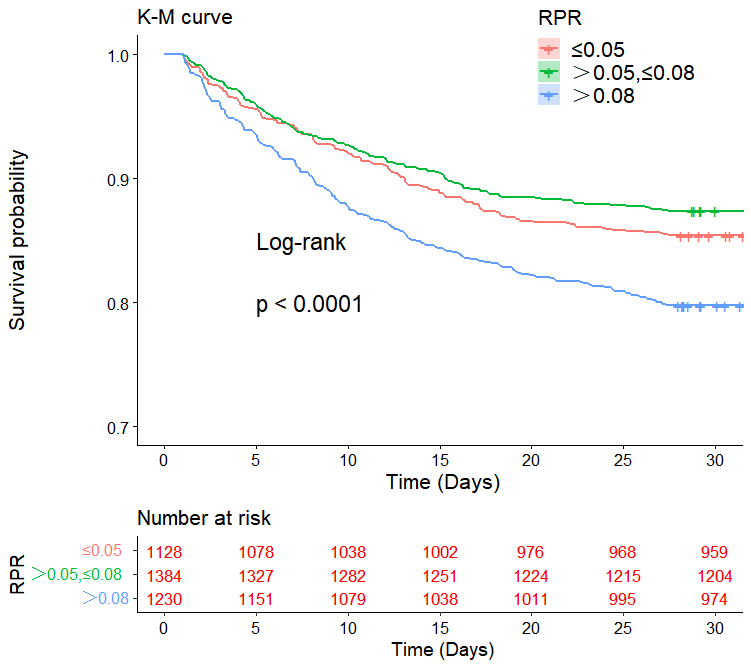
Figure 2 Kaplan–Meier survival curves showing 28-day mortality across three RPR tertile groups (≤0.05, >0.05 to ≤0.08, and >0.08). Log-rank test p-value <0.0001. “Number at risk” shown below the plot.
The specific selection process for the 3742 patients is illustrated in Figure 1. The baseline characteristics were analyzed according to the RPR tertiles (Table 1). There were 1128, 1384, and 1230 patients in the low-RPR (RPR ≤0.05), moderate-RPR (RPR >0.05 and ≤0.08), and high-RPR (RPR >0.08) groups. The mean age of the patients was 61.00 years (age range=49.00–73.00 years), 2351 (62.8%) patients were male, and 2631 (70.3%) were white. Vasoactive drugs were used to treat 1917 (51.2%) patients, and only 131 (3.5%) patients were treated using CRRT. Patients with RPR >0.08 were more likely to have comorbidities, including hypertension, chronic lung disease, diabetes, liver disease, renal failure, and higher values of SAPSII, APSIII, SOFA score, chloride, creatinine, potassium, sodium, BUN, INR, PT, APTT, RDW, and lower values of AG, bicarbonate, glucose, hematocrit, hemoglobin, platelets, RBCs, WBCs, heart rate, SBP, MBP, DBP, and RR. Figure 2 illustrates a difference in the survival curves of 28-day mortality between different RPR groups of patients with ARDS (p<0.0001).
Table 1. Characteristics of the study patients according to RPR.
| Variables | RPR | p | |||
|---|---|---|---|---|---|
| ≤0.05 | >0.05,≤0.08 | >0.08 | |||
| total | N=3742 | N=1128 | N=1384 | N=1230 | |
| gender (%) | <0.001 | ||||
| MALE | 2351 (62.8) | 699 (56.1) | 809 (64.9) | 843 (67.5) | |
| FEMALE | 1391 (37.2) | 548 (43.9) | 438 (35.1) | 405 (32.5) | |
| ethnicity (%) | 0.242 | ||||
| WHITE | 2631 (70.3) | 899 (72.1) | 875 (70.2) | 857 (68.7) | |
| BLACK | 256 ( 6.8) | 82 ( 6.6) | 85 ( 6.8) | 89 ( 7.1) | |
| ASIAN | 58 ( 1.5) | 18 ( 1.4) | 13 ( 1.0) | 27 ( 2.2) | |
|
HISPANIC/ LATINO |
118 ( 3.2) | 41 ( 3.3) | 43 ( 3.4) | 34 ( 2.7) | |
| OTHER | 679 (18.1) | 207 (16.6) | 231 (18.5) | 241 (19.3) | |
| vasopressor (%) | <0.001 | ||||
| NO | 1825 (48.8) | 680 (54.5) | 632 (50.7) | 513 (41.1) | |
| YES | 1917 (51.2) | 567 (45.5) | 615 (49.3) | 735 (58.9) | |
| CRRT (%) | <0.001 | ||||
| NO | 3611 (96.5) | 1227 (98.4) | 1217 (97.6) | 1167 (93.5) | |
| YES | 131 ( 3.5) | 20 ( 1.6) | 30 ( 2.4) | 81 ( 6.5) | |
| pulmonary circulation (%) | 0.88 | ||||
| NO | 3585 (95.8) | 1195 (95.8) | 1192 (95.6) | 1198 (96.0) | |
| YES | 157 ( 4.2) | 52 ( 4.2) | 55 ( 4.4) | 50 ( 4.0) | |
| hypertension (%) | <0.001 | ||||
| NO | 2017 (53.9) | 735 (58.9) | 616 (49.4) | 666 (53.4) | |
| YES | 1725 (46.1) | 512 (41.1) | 631 (50.6) | 582 (46.6) | |
| chronic pulmonary (%) | <0.001 | ||||
| NO | 3120 (83.4) | 1011 (81.1) | 1025 (82.2) | 1084 (86.9) | |
| YES | 622 (16.6) | 236 (18.9) | 222 (17.8) | 164 (13.1) | |
| diabetes (%) | <0.001 | ||||
| NO | 2923 (78.1) | 1018 (81.6) | 938 (75.2) | 967 (77.5) | |
| YES | 819 (21.9) | 229 (18.4) | 309 (24.8) | 281 (22.5) | |
| renal failure (%) | <0.001 | ||||
| NO | 3427 (91.6) | 1187 (95.2) | 1151 (92.3) | 1089 (87.3) | |
| YES | 315 ( 8.4) | 60 ( 4.8) | 96 ( 7.7) | 159 (12.7) | |
| liver disease (%) | <0.001 | ||||
| NO | 3296 (88.1) | 1185 (95.0) | 1163 (93.3) | 948 (76.0) | |
| YES | 446 (11.9) | 62 ( 5.0) | 84 ( 6.7) | 300 (24.0) | |
| anemias (%) | 0.573 | ||||
| NO | 3617 (96.7) | 1200 (96.2) | 1209 (97.0) | 1208 (96.8) | |
| YES | 125 ( 3.3) | 47 ( 3.8) | 38 ( 3.0) | 40 ( 3.2) | |
| age (year) | 61.00 [49.00, 73.00] | 59.00 [46.00, 72.00] | 61.00 [50.00, 73.00] | 62.00 [51.00, 73.00] | <0.001 |
| SAPSII | 37.00 [28.00, 47.00] | 36.00 [27.00, 46.00] | 34.00 [27.00, 44.00] | 39.00 [29.00, 50.00] | <0.001 |
| APSIII | 42.00 [30.00, 60.00] | 42.00 [31.00, 56.00] | 39.00 [28.00, 54.00] | 47.00 [32.00, 68.00] | <0.001 |
| SOFA | 5.00 [3.00, 7.00] | 4.00 [2.00, 6.00] | 4.00 [3.00, 6.00] | 6.00 [4.00, 9.00] | <0.001 |
| Anion gap (mmol/L) | 15.00 [12.00, 17.00] | 16.00 [13.00, 18.00] | 15.00 [12.00, 17.00] | 14.00 [12.00, 17.00] | <0.001 |
| bicarbonate (mg/dL) | 24.00 [21.00, 27.00] | 24.00 [21.00, 27.00] | 24.00 [22.00, 27.00] | 23.00 [21.00, 26.00] | <0.001 |
| chloride (mmol/L) | 104.00 [100.00, 108.00] | 103.00 [99.00, 107.00] | 104.00 [100.00, 108.00] | 105.00 [100.00, 110.00] | <0.001 |
| creatinine (md/dL) | 1.00 [0.70, 1.30] | 0.90 [0.70, 1.20] | 0.90 [0.70, 1.20] | 1.00 [0.80, 1.60] | <0.001 |
| glucose (mg/dL) | 129.00 [106.00, 165.00] | 133.00 [108.00, 171.00] | 134.00 [109.00, 166.00] | 124.00 [101.00, 158.00] | <0.001 |
| potassium (mmol/L) | 4.20 [3.80, 4.60] | 4.20 [3.80, 4.70] | 4.10 [3.80, 4.60] | 4.20 [3.80, 4.70] | <0.001 |
| sodium (mmol/L) | 139.00 [136.00, 141.00] | 139.00 [136.00, 141.00] | 139.00 [137.00, 141.00] | 139.00 [136.00, 141.00] | 0.001 |
| BUN (mg/dL) | 18.00 [13.00, 28.00] | 18.00 [13.00, 26.00] | 18.00 [13.00, 25.50] | 20.00 [14.00, 33.00] | <0.001 |
| hematocrit (%) | 34.60 [30.20, 39.20] | 36.30 [31.90, 40.40] | 35.60 [31.70, 39.80] | 31.90 [27.70, 36.70] | <0.001 |
| hemoglobin (g/dL) | 11.70 [10.10, 13.40] | 12.20 [10.60, 13.90] | 12.10 [10.70, 13.70] | 10.90 [9.47, 12.50] | <0.001 |
| INR | 1.20 [1.10, 1.50] | 1.20 [1.10, 1.30] | 1.20 [1.10, 1.40] | 1.40 [1.20, 1.70] | <0.001 |
| platelet (109/L) | 223.00 [157.00, 296.75] | 333.00 [291.00, 412.50] | 222.00 [198.50, 247.00] | 131.00 [93.00, 157.00] | <0.001 |
| PT (second) | 13.70 [12.80, 15.40] | 13.40 [12.70, 14.50] | 13.40 [12.70, 14.60] | 14.70 [13.30, 17.00] | <0.001 |
| APTT (second) | 29.00 [25.50, 35.20] | 27.30 [24.40, 31.75] | 28.20 [24.90, 32.90] | 32.90 [28.20, 40.90] | <0.001 |
| RDW (%) | 14.10 [13.30, 15.60] | 13.80 [13.00, 15.00] | 13.80 [13.20, 14.90] | 14.90 [13.70, 17.10] | <0.001 |
| RBC (k/ul) | 3.85 [3.33, 4.40] | 4.05 [3.57, 4.57] | 4.01 [3.50, 4.51] | 3.49 [3.02, 4.01] | <0.001 |
| WBC (k/ul) | 11.40 [8.00, 16.20] | 13.70 [9.80, 19.05] | 11.60 [8.40, 15.60] | 9.20 [6.30, 13.40] | <0.001 |
| heart rate (beats/minute) | 90.00 [79.00, 106.00] | 93.00 [80.00, 108.00] | 89.00 [77.00, 104.00] | 89.00 [80.00, 106.00] | <0.001 |
| SBP (mmHg) | 120.00 [103.00, 136.00] | 122.00 [105.00, 139.00] | 120.00 [104.00, 135.00] | 117.00 [100.00, 134.00] | <0.001 |
| MBP (mmHg) | 78.00 [66.67, 90.67] | 80.00 [68.33, 92.17] | 78.00 [67.00, 90.33] | 76.00 [65.00, 88.33] | <0.001 |
| RR (beats/minute) | 18.00 [14.00, 23.00] | 18.00 [14.00, 24.00] | 17.00 [14.00, 22.00] | 17.00 [13.00, 23.00] | <0.001 |
| temperature (◦C) | 36.83 [36.11, 37.50] | 36.83 [36.11, 37.56] | 36.83 [36.11, 37.50] | 36.72 [36.11, 37.44] | 0.135 |
| DBP (mmHg) | 59.00 [49.00, 71.00] | 60.00 [51.00, 72.00] | 59.00 [49.00, 71.00] | 57.00 [47.00, 69.00] | <0.001 |
RPR: RDW-to-platelet ratio; CRRT: continuous renal replacement therapy; SAPSII: Simplified Acute Physiology Score-II; APSIII: Acute Physiology
Score-III; SOFA: Sequential Organ Failure Assessment; BUN: blood urea nitrogen; INR: international normalized ratio; PT: prothrombin time; APTT: activated partial
thromboplastin time; RDW: red blood cell distribution width; RBC: red blood cell; WBC: white blood cells; SBP: systolic blood pressure; MBP: mean blood pressure; RR: respiratory rate; DBP: diastolic blood pressure.
2.2 Univariate and Multivariate Cox Regression Analyses
Two multivariate Cox models were constructed: model I was only adjusted for age, gender, and ethnicity, whereas model II was adjusted for confounding factors including age, gender, ethnicity, pulmonary circulatory disease, hypertension, chronic lung disease, diabetes, liver disease, renal failure, anemia, AG, bicarbonate, chloride, glucose, potassium, sodium, creatinine, BUN, RBCs, WBCs, hematocrit, hemoglobin, INR, PT, APTT, CRRT use, vasopressor use, SAPSII, APSIII, SOFA score, SBP, MBP, DBP, temperature, RR, and heart rate. The univariate and the two multivariate Cox models indicated that the high-RPR group had the highest 28-day mortality risk. In the univariate model, model I, and model II, with the low-RPR group as a reference, the HRs of the high-RPR group were 1.432 (95% CI=1.176–1.743, p<0.001), 1.332 (95% CI=1.092–1.626, p=0.005), and 1.434 (95% CI=1.135–1.812, p=0.003), respectively, whereas the moderate-RPR group did not show significant differences among the three models (p=0.155, p=0.059, and p=0.751, respectively; Table 2).
Table 2. HRs (95% CIs) for 28-day mortality across groups of RPR.
| Variables | Nonadjusted | Model I | Model II | ||||||
|---|---|---|---|---|---|---|---|---|---|
| HR | 95%CI | P value | HR | 95%CI | P value | HR | 95%CI | P value | |
| 28-day mortality | |||||||||
| Tertiles | |||||||||
| ≤0.05 | Reference | Reference | Reference | ||||||
| >0.05, ≤0.08 | 0.857 | 0.693-1.060 | 0.155 | 0.814 | 0.657-1.008 | 0.059 | 1.037 | 0.829-1.296 | 0.751 |
| >0.08 | 1.432 | 1.176-1.743 | <0.001 | 1.332 | 1.092-1.626 | 0.005 | 1.434 | 1.135-1.812 | 0.003 |
HR: hazard ratio; CI: confidence interval. Models were derived from Cox proportional hazards regression models. Nonadjusted model adjusted for none. Adjust
I model adjusted for age, gender, ethnicity. Adjust II model adjusted for age, gender, ethnicity, pulmonary circulatory disease, hypertension, chronic lung disease, diabetes, liver disease, renal failure, anemia, AG, bicarbonate, chloride, glucose, potassium, sodium, creatinine, BUN, RBCs, WBCs, hematocrit, hemoglobin, INR, PT, APTT, CRRT use, vasopressor use, SAPSII, APSIII, SOFA score, SBP, MBP, DBP, temperature, RR, and heart rate.
2.3 Association Between RPR and Mortality
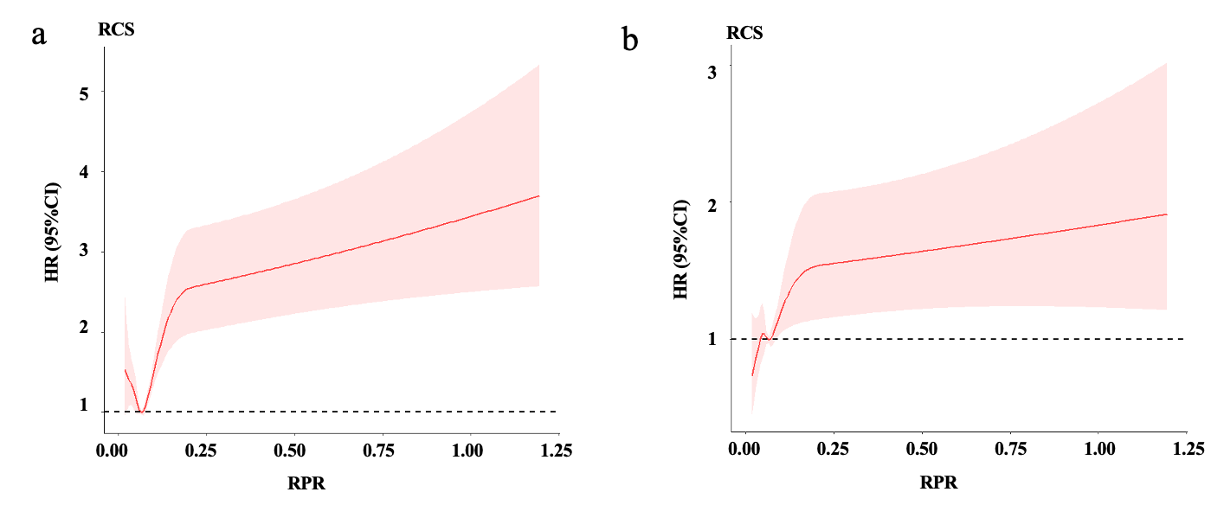
Figure 2 Restricted cubic spline model illustrating the nonlinear relationship between RPR and 28-day mortality. A V-shaped association is observed, with increased mortality at both low and high ends of RPR. (a) Unadjusted model; (b) Fully adjusted model (Model II). Shaded areas indicate 95% confidence intervals.
Figure 3 illustrates the relationship between RPR and mortality using a restricted cubic spline (RCS) model. Dose–response analysis indicated a V-shaped curve (nonlinear p<0.0001) between RPR and 28-day mortality in patients with ARDS (Figure 3a). We also constructed an RCS model corresponding to model II in the Cox regression. After adding the covariates in model II, the dose–response curve of RPR and mortality still had a nonlinear relationship (nonlinear p=0.022, Figure 3b).
2.4 Subgroup Analyses
The subgroup analysis indicated that the relationship between RPR and 28-day mortality was similar in all subgroups of patients with ARDS (Table 3), with no significant interaction (p=0.185–0.980). This indicates that there were no other factors affecting the association between RPR and mortality.
Table 3. Subgroup analysis of the associations between the RPR and 28-day all-cause mortality.
| RPR | P for interaction | ||||
|---|---|---|---|---|---|
| Characteristics | No. of patients | ≤0.05 HR (95% CI) | >0.05,≤0.08 HR (95% CI) | >0.08 HR (95% CI) | |
| vasopressor | 0.185 | ||||
| YES | 1917 | 1.0 (ref) | 1.031(0.776-1.370) | 1.440(1.068-1.942) | |
| NO | 1825 | 1.0 (ref) | 0.954(0.659-1.381) | 1.324(0.882-1.987) | |
| CRRT | 0.732 | ||||
| YES | 131 | 1.0 (ref) | — | — | |
| NO | 3611 | 1.0 (ref) | 1.023(0.812-1.288) | 1.437(1.124-1.837) | |
| pulmonary circulation | 0.836 | ||||
| YES | 157 | 1.0 (ref) | — | — | |
| NO | 3585 | 1.0 (ref) | 1.038(0.825-1.307) | 1.430(1.122-1.823) | |
| hypertension | 0.889 | ||||
| YES | 1725 | 1.0 (ref) | 0.846(0.602-1.189) | 1.064(0.730-1.553) | |
| NO | 2017 | 1.0 (ref) | 1.140(0.841-1.545) | 1.780(1.309-2.419) | |
| chronic pulmonary | 0.355 | ||||
| YES | 622 | 1.0 (ref) | — | — | |
| NO | 3120 | 1.0 (ref) | 1.099(0.850-1.422) | 1.538(1.183-1.999) | |
| diabetes | 0.824 | ||||
| YES | 819 | 1.0 (ref) | — | — | |
| NO | 2923 | 1.0 (ref) | 1.087(0.850-1.399) | 1.554(1.196-2.019) | |
| renal failure | 0.227 | ||||
| YES | 315 | 1.0 (ref) | 0.887(0.377-2.085) | 0.512(0.221-1.185) | |
| NO | 3427 | 1.0 (ref) | 1.078(0.852-1.364) | 1.631(1.274-2.089) | |
| liver disease | 0.704 | ||||
| YES | 446 | 1.0 (ref) | 1.856(0.930-3.704) | 1.441(0.745-2.787) | |
| NO | 3296 | 1.0 (ref) | 1.027(0.809-1.305) | 1.398(1.078-1.812) | |
| anemias | 0.980 | ||||
| YES | 125 | 1.0 (ref) | — | — | |
| NO | 3617 | 1.0 (ref) | 1.063(0.847-1.334) | 1.450(1.143-1.839) | |
| gender | 0.633 | ||||
| MALE | 2351 | 1.0 (ref) | 1.024(0.758-1.385) | 1.405(1.030-1.917) | |
| FEMALE | 1391 | 1.0 (ref) | 1.070(0.761-1.506) | 1.495(1.027-2.176) | |
| ethnicity | 0.458 | ||||
| WHITE | 2631 | 1.0 (ref) | 0.822(0.621-1.089) | 1.224(0.915-1.638) | |
| BLACK | 256 | 1.0 (ref) | 1.186(0.395-3.557) | 1.678(0.523-5.380) | |
| ASIAN | 58 | 1.0 (ref) | — | — | |
| HISPANIC/ LATINO | 118 | 1.0 (ref) | — | — | |
| OTHER | 679 | 1.0 (ref) | 1.859(1.162-2.972) | 2.224(1.353-3.655) | |
| age (year) | 0.414 | ||||
| <61 | 1851 | 1.0 (ref) | 1.117(0.736-1.696) | 1.528(0.991-2.356) | |
| ≥61 | 1891 | 1.0 (ref) | 0.957(0.730-1.253) | 1.402(1.050-1.873) | |
| SAPSII | 0.905 | ||||
| <37 | 1856 | 1.0 (ref) | 1.300(0.810-2.085) | 1.006(0.550-1.841) | |
| ≥37 | 1886 | 1.0 (ref) | 0.982(0.761-1.267) | 1.517(1.167-1.970) | |
| APSIII | 0.374 | ||||
| <42 | 1812 | 1.0 (ref) | 0.998(0.622-1.602) | 1.231(0.689-2.198) | |
| ≥42 | 1930 | 1.0 (ref) | 1.138(0.879-1.473) | 1.576(1.209-2.053) | |
| SOFA | 0.942 | ||||
| <5 | 1738 | 1.0 (ref) | 1.091(0.769-1.549) | 1.049(0.626-1.757) | |
| ≥5 | 2004 | 1.0 (ref) | 1.036(0.772-1.390) | 1.580(1.188-2.102) | |
| Anion gap (mmol/L) | 0.261 | ||||
| <15 | 1781 | 1.0 (ref) | 0.701(0.457-1.076) | 1.309(0.846-2.025) | |
| ≥15 | 1961 | 1.0 (ref) | 1.202(0.924-1.564) | 1.645(1.235-2.190) | |
| bicarbonate (mg/dL) | 0.715 | ||||
| <24 | 1717 | 1.0 (ref) | 1.026(0.736-1.430) | 1.520(1.081-2.137) | |
| ≥24 | 2025 | 1.0 (ref) | 0.991(0.730-1.344) | 1.268(0.904-1.778) | |
| chloride (mmol/L) | 0.949 | ||||
| <104 | 1711 | 1.0 (ref) | 1.275(0.959-1.695) | 1.693(1.254-2.286) | |
| ≥104 | 2031 | 1.0 (ref) | 0.756(0.523-1.095) | 1.126(0.762-1.663) | |
| creatinine (md/dL) | 0.415 | ||||
| <1 | 1859 | 1.0 (ref) | — | — | |
| ≥1 | 1883 | 1.0 (ref) | 1.088(0.809-1.463) | 1.436(1.059-1.949) | |
| glucose (mg/dL) | 0.839 | ||||
| <129 | 1832 | 1.0 (ref) | 0.857(0.611-1.201) | 1.269(0.917-1.756) | |
| ≥129 | 1910 | 1.0 (ref) | 1.236(0.910-1.679) | 1.574(1.104-2.245) | |
| potassium (mmol/L) | 0.229 | ||||
| <4.2 | 1792 | 1.0 (ref) | 1.087(0.765-1.544) | 1.250(0.859-1.820) | |
| ≥4.2 | 1950 | 1.0 (ref) | 0.999(0.743-1.344) | 1.552(1.144-2.106) | |
| sodium (mmol/L) | 0.748 | ||||
| <139 | 1696 | 1.0 (ref) | 1.174(0.855-1.612) | 1.873(1.352-2.594) | |
| ≥139 | 2046 | 1.0 (ref) | 0.876(0.636-1.207) | 1.050(0.747-1.476) | |
| BUN (mg/dL) | 0.605 | ||||
| <18 | 1732 | 1.0 (ref) | 1.016(0.652-1.584) | 1.113(0.647-1.916) | |
| ≥18 | 2010 | 1.0 (ref) | 1.032(0.794-1.343) | 1.448(1.108-1.892) | |
| HCT (%) | 0.674 | ||||
| <34.6 | 1856 | 1.0 (ref) | 0.942(0.679-1.308) | 1.173(0.856-1.607) | |
| ≥34.6 | 1886 | 1.0 (ref) | 1.177(0.859-1.613) | 1.899(1.315-2.743) | |
| hemoglobin (g/dL) | 0.722 | ||||
| <11.7 | 1827 | 1.0 (ref) | 0.921(0.664-1.278) | 1.261(0.924-1.721) | |
| ≥11.7 | 1915 | 1.0 (ref) | 1.204(0.876-1.656) | 1.770(1.221-2.566) | |
| INR | 0.934 | ||||
| <1.2 | 1333 | 1.0 (ref) | 0.942(0.635-1.397) | 1.186(0.738-1.905) | |
| ≥1.2 | 2409 | 1.0 (ref) | 1.106(0.840-1.456) | 1.504(1.138-1.987) | |
| PT (second) | 0.658 | ||||
| <13.7 | 1832 | 1.0 (ref) | 0.976(0.706-1.348) | 1.317(0.897-1.933) | |
| ≥13.7 | 1910 | 1.0 (ref) | 1.205(0.878-1.654) | 1.586(1.158-2.173) | |
| APTT (second) | 0.210 | ||||
| <29 | 1857 | 1.0 (ref) | 1.145(0.840-1.560) | 1.712(1.188-2.468) | |
| ≥29 | 1885 | 1.0 (ref) | 0.925(0.662-1.293) | 1.276(0.925-1.760) | |
| RBC (k/ul) | 0.742 | ||||
| <3.85 | 1867 | 1.0 (ref) | 1.029(0.730-1.452) | 1.401(1.015-1.932) | |
| ≥3.85 | 1875 | 1.0 (ref) | 1.099(0.809-1.492) | 1.512(1.040-2.199) | |
| WBC (k/ul) | 0.890 | ||||
| <11.4 | 1853 | 1.0 (ref) | 0.706(0.482-1.034) | 1.273(0.880-1.843) | |
| ≥11.4 | 1889 | 1.0 (ref) | 1.278(0.967-1.688) | 1.796(1.293-2.495) | |
| heart_rate (beats/minute) | 0.426 | ||||
| <90 | 1803 | 1.0 (ref) | 0.775(0.546-1.100) | 0.928(0.633-1.361) | |
| ≥90 | 1939 | 1.0 (ref) | 0.928(0.633-1.361) | 1.983(1.458-2.698) | |
| SBP (mmHg) | 0.858 | ||||
| <120 | 1854 | 1.0 (ref) | 1.170(0.840-1.629) | 1.681(1.212-2.331) | |
| ≥120 | 1888 | 1.0 (ref) | 0.957(0.699-1.310) | 1.238(0.867-1.769) | |
| MBP (mmHg) | 0.687 | ||||
| <78 | 1862 | 1.0 (ref) | 1.130(0.810-1.578) | 1.238(0.867-1.769) | |
| ≥78 | 1880 | 1.0 (ref) | 0.978(0.715-1.336) | 1.203(0.837-1.729) | |
| RR (beats/minute) | 0.266 | ||||
| <18 | 1866 | 1.0 (ref) | 1.452(0.978-2.155) | 1.667(1.073-2.590) | |
| ≥18 | 1876 | 1.0 (ref) | 0.942(0.714-1.241) | 1.465(1.105-1.942) | |
| temperature (◦C) | 0.872 | ||||
| <36.83 | 1856 | 1.0 (ref) | 1.098(0.807-1.492) | 1.272(0.920-1.760) | |
| ≥36.83 | 1886 | 1.0 (ref) | 1.017(0.723-1.429) | 1.761(1.235-2.513) | |
| DBP (mmHg) | 0.509 | ||||
| <59 | 1841 | 1.0 (ref) | 1.084(0.778-1.511) | 1.621(1.169-2.247) | |
| ≥59 | 1901 | 1.0 (ref) | 1.033(0.758-1.408) | 1.298(0.913-1.845) | |
RPR: RDW-to-platelet ratio; CRRT: continuous renal replacement therapy; SAPSII: Simplified Acute Physiology Score-II; APSIII: Acute Physiology
Score-III; SOFA: Sequential Organ Failure Assessment; BUN: blood urea nitrogen; INR: international normalized ratio; PT: prothrombin time; APTT: activated partial
Thromboplastin time; RBC: red blood cell; WBC: white blood cells; SBP: systolic blood pressure; MBP: mean blood pressure; RR: respiratory rate; DBP: diastolic blood pressure.
3. Discussion
This study analyzed 3742 patients with ARDS to determine the relationship between RPR and 28 days all-cause mortality. The mortality risk in patients with ARDS was higher in the high-RPR group (RPR ≥0.08) than in the low-RPR group (RPR <0.05). After the adjustment in models I and II, the correlations were still significant. Higher RPR was associated with increased mortality, and the dose–response analysis indicated a V-shaped curve between RPR and mortality in patients with ARDS. The observed increase in mortality at low RPR might indicate conditions such as reactive thrombocytosis or suppressed RDW due to acute inflammation, both associated with severe systemic inflammatory responses seen in ARDS. These results mean that RPR, as a convenient laboratory parameter, is of high value in evaluating the prognosis of patients with ARDS. ARDS pathogenesis includes lung endothelial and epithelial cell injuries, an excessive inflammatory response, coagulation disorder, fibrosis, and apoptosis[2]. Two previous studies that utilized the MIMIC-III database found that RDW and platelet count are risk factors for ARDS mortality[9, 20]. However, the samples in those two studies were small. Both RDW and platelet count are also related to inflammatory response, and their changes can affect each other. RPR can reflect the severity of systemic inflammation. An excessive inflammatory response plays a decisive role in ARDS progression, indicating that RPR may be related to ARDS.
There are at least two possible reasons for the relationship between increased RPR and increased ARDS mortality. When the platelet count is constant, increased RDW will lead to increased RPR. The pathophysiological mechanism of the relationship between RDW and ARDS is not clear, but it may be related to an excessive inflammatory response. Many studies have found that an increased level of pro-inflammatory cytokines, neutrophil accumulation, and the destruction of capillary barriers of pulmonary endothelial and epithelial cells may be the mechanisms leading to ARDS[21, 22]. Under pathological conditions, especially under the stimulation of inflammatory factors, immature RBCs and reticulocytes are excessively generated and released into the peripheral blood circulation, causing increased RDW[23]. On the other hand, when RDW is constant, a decreased platelet count will also lead to increased RPR. The enhanced inflammatory response in patients with sepsis will lead to the release of platelet-leukocyte complexes and cell adhesion molecules, which will reduce platelet counts[24–26]. At the same time, an excessive inflammatory response will also lead to platelet-mediated thrombosis, thus promoting the occurrence and development of ARDS[27–29]. RPR integrates inflammatory and coagulation responses, particularly through platelet-leukocyte interactions, endothelial dysfunction, and thrombosis pathways. Recent studies highlight that elevated RDW correlates with cytokine release and impaired erythropoiesis, while platelet reduction often reflects consumption due to systemic thrombosis in severe ARDS or COVID-19. These findings explain the close relationship between platelets and ARDS. The LRRC16A gene is also considered to be a quantitative trait locus that regulates platelet count. Studies have found that the LRRC16A gene can regulate the basic platelet count in critically ill patients with ARDS[30]. Clinicians should therefore pay attention to RPR changes in patients with ARDS. It is important to note that we include RPR as a new indicator because it does not reflect changes in RDW or platelet alone. When RDW and platelet rise or fall at the same time, the changes in RPR may differ from them. RPR reflects the difference in the ratio of RDW to platelet, which may be new clinical information rather than RDW or platelet. Further studies are needed to explore the relationship between the ratio and the single parameters.
Although both RDW and platelet count have previously been associated with ARDS prognosis, they each reflect only a portion of the inflammatory or coagulatory status. In our study, RPR, as a composite index, showed stronger and more consistent associations with 28-day mortality than RDW or platelet count alone (data not shown). This suggests that RPR may capture synergistic prognostic information beyond its individual components. Compared with traditional scoring systems like SOFA, RPR provided additional prognostic information. Although comprehensive comparisons such as ROC or NRI analyses are beyond the current study’s scope, future studies could further explore these analyses. After the adjustments in model I and model II, the correlations were still significant, indicating that our results were highly stable. RPR can be conveniently incorporated into clinical practice for early risk stratification, dynamic patient monitoring, and facilitating timely triage decisions. Its simplicity offers advantages over complex biomarkers requiring specialized testing.
This study also had some limitations. First, the study had a single-center retrospective design, which questions the generalizability of the conclusions. Second, this study collected the first RDW and platelet counts of patients within 24 hours of ICU admission and no subsequent data, which may have affected the results. Third, the MIMIC-III database only contains patient information from 2001 to 2012, and changes in ARDS since then may affect the applicability of our conclusions.
4. Materials and Methods
4.1 Data Source
The study included 3742 patients with ARDS. The analyzed data were obtained from the Medical Information Mart for Intensive Care-III (MIMIC-III) database (version 1.4)[16]. This database contains the health-related data of more than 60,000 ICU patients who presented at the Beth Israel Deaconess Medical Center from 2001 to 2012 (Boston, USA). The database includes various parameters, including patient demographic data, as a result of completing the recognized “Protecting Human Research Participants” course, we gained access to the database that contains vital sign measurements, laboratory parameters, procedures, drugs, and imaging reports. (certification record ID: 45438891).
4.2 Participant Selection
Since the MIMIC-III database spans from 2001 to 2012, most patient data were recorded prior to the publication of the Berlin definition in 2012. To approximate this definition as closely as possible, we identified ARDS cases based on a combination of clinical information, including ICD-9 codes (518.5, 518.81, 518.82, 518.85, 786.09), PaO₂/FiO₂ ratios, ventilator parameters (PEEP ≥ 5 cmH₂O), and clinical documentation. Inclusion criteria were as follows: (1) patients aged ≥18 years; and (2) ICU admission with ARDS meeting the Berlin criteria, operationalized as PaO₂/FiO₂ < 300 mmHg with PEEP ≥ 5 cmH₂O. Because imaging data were not available in the MIMIC-III database, we excluded patients likely to have cardiogenic pulmonary edema or alternative diagnoses, using surrogate markers such as pulmonary capillary wedge pressure ≥18 cmH₂O or diagnostic codes indicating pleural effusion, lung collapse, or pulmonary nodules. Patients were excluded if they had (1) missing RDW or platelet data within the first 24 hours of ICU admission; (2) ICU stays shorter than 24 hours; or (3) incomplete comorbidity records. For patients with multiple ICU admissions, only the first ICU stay was included (see Figure 1 for the patient selection flowchart).
4.3 Data Extraction
We collected data on demographics, comorbidities, laboratory parameters, vital signs, clinical scoring systems, and some treatment methods[17]. Demographics included age, gender, and ethnicity. Comorbidities include pulmonary circulatory disease, hypertension, chronic lung disease, diabetes, liver disease, renal failure, and anemia. Laboratory parameters included RDW, platelets, anion gap (AG), bicarbonate, chloride, creatinine, glucose, potassium, sodium, blood urea nitrogen (BUN), hematocrit, hemoglobin, international normalized ratio (INR), prothrombin time (PT), activated partial thromboplastin time (APTT), red blood cells (RBCs) and white blood cells (WBCs).Vital signs included heart rate, systolic blood pressure (SBP), mean blood pressure (MBP), diastolic blood pressure (DBP), respiratory rate (RR), and temperature. Clinical scoring systems include Sequential Organ Failure Assessment (SOFA), Simple Acute Physiology Score-II (SAPSII), and Acute Physiology Score-III (APSIII). Treatment methods included continuous renal replacement therapy (CRRT) and vasopressors. The principles of including variables are as follows: (1) Easy to obtain in the MIMIC database; (2) Easy to obtain in ICU clinical treatment; (3) May interact with RDW or platelet; (4) May interact with ARDS. We excluded variables with >20% missing values. We collected the first value within 24 hours of the patient's admission to the ICU. If no data is obtained within 24 hours, the value is considered missing. Data related to the diagnosis of ARDS (e.g. PaO2, FiO2, PEEP, etc.) were obtained at the same time. Other parameters may not be obtained at the same time, but all within 24 hours of the patient's admission to the ICU. The patients were divided into three RPR tertiles. The endpoint of this study was 28-day all-cause mortality. Missing data rates for key variables ranged from 1.2% (RDW and platelet counts) to 17.8% (clinical scoring parameters). We assumed data were missing at random (MAR), and multiple imputation was performed using the 'mice' package in R. Additionally, we conducted sensitivity analyses using complete-case analysis, finding consistent results.
4.4 Statistical Analyses
RPR tertiles were used to divide the patients into low-, moderate-, and high-RPR groups[18]. The RPR tertile cut-offs (≤0.05, 0.05–0.08, >0.08) were determined based on prior literature that explored RPR as a prognostic biomarker in related conditions (Cetinkaya et al., 2014; Takeuchi et al., 2019). All categorical variables were expressed as numbers and percentages, and chi-square and Fisher's exact tests were used to identify differences between the three groups.. We calculated Mann-Whitney U tests for differences among the three groups by expressing continuous variables as medians and interquartile ranges. The correlations between the two groups and the outcome were analyzed using Kaplan-Meier and Cox proportional-hazards regression models. Log-rank tests were performed as nonparametric analyses to compare the survival distributions of the three groups. These results are expressed as hazard ratios (HRs) with 95% confidence intervals (CIs).
Two Cox models were constructed: model 1 was only adjusted for age, gender, and ethnicity[18], whereas model II was adjusted for age, gender, ethnicity, pulmonary circulatory disease, hypertension, chronic lung disease, diabetes, liver disease, renal failure, anemia, AG, bicarbonate, chloride, glucose, potassium, sodium, creatinine, BUN, RBCs, WBCs, hematocrit, hemoglobin, INR, PT, APTT, CRRT use, vasopressor use, SAPSII, APSIII, SOFA score, SBP, MBP, DBP, temperature, RR, and heart rate. The association between RPR and 28-day mortality was analyzed by applying a hierarchical linear regression model to the subgroups.
All statistical analyses were performed using R software (version 4.1.1, Vienna, Austria). The significance threshold was a bilateral probability value of p<0.05. We excluded variables with >20% missing values. For the included variables, we used the “mice” R software package to perform multiple imputation on missing data[19]. Multiple imputation was conducted under the assumption of missing at random (MAR) using the MICE package in R (5 imputations, 10 iterations). We also performed a complete-case sensitivity analysis, which yielded comparable results, indicating robustness.
5. Conclusions
Increased RPR at ICU admission is significantly correlated with a higher risk of 28-day mortality, suggesting that RPR, as a convenient laboratory parameter, is of great value in evaluating the prognosis of patients with ARDS. The inclusion of PRR in routine evaluations may help doctors to make better clinical decisions for their patients. However, the results of this study need to be verified in large prospective studies.
Declarations
Ethics approval and consent to participate
This study was conducted in accordance with the Declaration of Helsinki. Institutional review board approval and informed consent were not required in current study because MIMIC-III research data is publicly available and all patient data are de-identified. The patient's information has been hidden before the study. There is no need for the patient's informed consent and no ethical conflict.
Consent for publication
Not applicable.
Availability of data and materials
All data generated or analysed during this study are included in this published article. The data that support the findings of this study are available in [MIMIC-III Clinical Database] at [https://physionet.org/]. These data were derived from the following resources available in the public domain: [MIMIC-III Clinical Database v1.4 (physionet.org)].
Competing interests
The authors declare no competing interests.
Funding
No funding
Authors' contributions
Han Li conceived and designed the study. Zhenzhen Ma and Qun Gao supervised the research process and provided critical revisions. Yang Wang and Yang Yu were responsible for data extraction and statistical analysis. Zheng Jing contributed to data visualization and figure preparation. Han Li drafted the manuscript. All authors reviewed and approved the final version of the manuscript.
Acknowledgements
This study is grateful to all the authors for their full contributions.
References
-
H. Xu, S. Sheng, W. Luo, X. Xu, Z. Zhang. "Acute respiratory distress syndrome heterogeneity and the septic ARDS subgroup." Front. Immunol. 2023, 14.
-
M. A. Matthay, R. L. Zemans, G. A. Zimmerman, Y. M. Arabi, J. R. Beitler, A. Mercat, M. Herridge, A. G. Randolph, C. S. Calfee. "Acute respiratory distress syndrome." Nat Rev Dis Primers 2019, 5, 1, 1-22.
-
M. S. Zinter, B. E. Orwoll, A. C. Spicer, M. F. Alkhouli, C. S. Calfee, M. A. Matthay, A. Sapru. "Incorporating Inflammation into Mortality Risk in Pediatric Acute Respiratory Distress Syndrome." Crit Care Med 2017, 45, 5, 858-66.
-
G. L. Salvagno, F. Sanchis-Gomar, A. Picanza, G. Lippi. "Red blood cell distribution width: A simple parameter with multiple clinical applications." Critical Reviews in Clinical Laboratory Sciences 2015, 52, 2, 86-105.
-
J. W. Uffen, P. Oomen, M. de Regt, J. J. Oosterheert, K. Kaasjager. "The prognostic value of red blood cell distribution width in patients with suspected infection in the emergency department." BMC Emerg Med 2019, 19, 1, 76.
-
F.-X. Zhang, Z.-L. Li, Z.-D. Zhang, X.-C. Ma. "Prognostic value of red blood cell distribution width for severe acute pancreatitis." WJG 2019, 25, 32, 4739-48.
-
N. Cai, M. Jiang, C. Wu, F. He. "Red Cell Distribution Width at Admission Predicts the Frequency of Acute Kidney Injury and 28-Day Mortality in Patients With Acute Respiratory Distress Syndrome." J Intensive Care Med 2022, 57, 3, 370-77.
-
T. Karampitsakos, K. Akinosoglou, O. Papaioannou, V. Panou, A. Koromilias, P. Bakakos, S. Loukides, D. Bouros, C. Gogos, A. Tzouvelekis. "Increased Red Cell Distribution Width Is Associated With Disease Severity in Hospitalized Adults With SARS-CoV-2 Infection: An Observational Multicentric Study." Front. Med. 2020, 7, 616292.
-
B. Wang, Y. Gong, B. Ying, B. Cheng. "Relation between Red Cell Distribution Width and Mortality in Critically Ill Patients with Acute Respiratory Distress Syndrome." BioMed Research International 2019, 2019, 1-8.
-
J. D. Bessman. "Evaluation of Automated Whole-blood Platelet Counts and Particle Sizing." Am J Clin Pathol 1980, 74, 2, 157-62.
-
T. K. Jones, N. J. Meyer. "What's in a Number? Platelet Count Dynamics as a Novel Mediator of Acute Respiratory Distress Syndrome Survival." Am J Respir Crit Care Med 2017, 195, 10, 1285-87.
-
B. Karabulut, B. C. Arcagok. "New Diagnostic Possibilities for Early Onset Neonatal Sepsis: Red Cell Distribution Width to Platelet Ratio." Fetal and Pediatric Pathology 2020, 39, 4, 297-306.
-
F. Lehmann, L. M. Schenk, J. D. Bernstock, C. Bode, V. Borger, F. A. Gessler, E. Güresir, M. Hamed, A.-L. Potthoff, C. Putensen, M. Schneider, J. Zimmermann, H. Vatter, P. Schuss, A. Hadjiathanasiou. "Elevated Red Cell Distribution Width to Platelet Ratio Is Associated With Poor Prognosis in Patients With Spontaneous, Deep-Seated Intracerebral Hemorrhage." Front. Neurol. 2021, 12.
-
E. Çetinkaya, K. Şenol, B. Saylam, M. Tez. "Red cell distribution width to platelet ratio: New and promising prognostic marker in acute pancreatitis." World J Gastroenterol 2014, 20, 39, 14450-54.
-
H. Takeuchi, M. Abe, Y. Takumi, T. Hashimoto, M. Miyawaki, T. Okamoto, K. Sugio. "Elevated red cell distribution width to platelet count ratio predicts poor prognosis in patients with breast cancer." Sci Rep 2019, 9, 1, 3033.
-
J. Yang, Y. Li, Q. Liu, L. Li, A. Feng, T. Wang, S. Zheng, A. Xu, J. Lyu. "Brief introduction of medical database and data mining technology in big data era." J Evid Based Med 2020, 13, 1, 57-69.
-
W.-T. Wu, Y.-J. Li, A.-Z. Feng, L. Li, T. Huang, A.-D. Xu, J. Lyu. "Data mining in clinical big data: the frequently used databases, steps, and methodological models." Military Med Res 2021, 8, 1, 44.
-
B. Wang, G. Aihemaiti, B. Cheng, X. Li. "Red Blood Cell Distribution Width Is Associated with All-Cause Mortality in Critically Ill Patients with Cardiogenic Shock." Med Sci Monit 2019, 25, 7005-15.
-
Z. Zhang. "Multiple imputation with multivariate imputation by chained equation (MICE) package." Ann Transl Med 2016, 4, 2, 30.
-
R. Wang, H. Dai. "Association of platelet count with all-cause mortality from acute respiratory distress syndrome: A cohort study." Clin Respir J 2022, 36, 5, e24378.
-
X. Huang, G. Kong, Y. Li, W. Zhu, H. Xu, X. Zhang, J. Li, L. Wang, Z. Zhang, Y. Wu, X. Liu, X. Wang. "Decitabine and 5-azacitidine both alleviate LPS induced ARDS through anti-inflammatory/antioxidant activity and protection of glycocalyx and inhibition of MAPK pathways in mice." Biomedicine & Pharmacotherapy 2016, 84, 447-53.
-
S. M. Brown, C. K. Grissom, M. T. Rondina, J. R. Hoidal, M. B. Scholand, R. K. Wolff, A. H. Morris, R. Paine III. "Polymorphisms in key pulmonary inflammatory pathways and the development of acute respiratory distress syndrome." Exp Lung Res 2015, 41, 3, 155-62.
-
N. S. Ku, H. Kim, H. J. Oh, Y. C. Kim, M. H. Kim, J. E. Song, D. H. Oh, J. Y. Ahn, S. B. Kim, S. J. Jeong, S. H. Han, C. O. Kim, Y. G. Song, J. M. Kim, J. Y. Choi. "Red Blood Cell Distribution Width Is an Independent Predictor of Mortality in Patients With Gram-Negative Bacteremia." Shock 2012, 38, 2, 123.
-
M. Bhatia, S. Moochhala. "Role of inflammatory mediators in the pathophysiology of acute respiratory distress syndrome." J Pathol 2004, 202, 2, 145-56.
-
J. P. Reilly, J. D. Christie. "Linking Genetics to ARDS Pathogenesis: The Role of the Platelet." CHEST 2015, 147, 3, 585-86.
-
L. B. Ware, T. Koyama, Z. Zhao, D. R. Janz, N. Wickersham, G. R. Bernard, A. K. May, C. S. Calfee, M. A. Matthay. "Biomarkers of lung epithelial injury and inflammation distinguish severe sepsis patients with acute respiratory distress syndrome." Crit Care 2013, 17, 5, R253.
-
A. I. Schafer, R. I. Handin. "The role of platelets in thrombotic and vascular disease." Progress in Cardiovascular Diseases 1979, 22, 1, 31-52.
-
L. Fernández-Martín, B. Marcos-Ramiro, C. L. Bigarella, M. Graupera, R. J. Cain, N. Reglero-Real, A. Jiménez, E. Cernuda-Morollón, I. Correas, S. Cox, A. J. Ridley, J. Millán. "Crosstalk Between Reticular Adherens Junctions and Platelet Endothelial Cell Adhesion Molecule-1 Regulates Endothelial Barrier Function." Arterioscler Thromb Vasc Biol 2012, 32, 3, e13-e22.
-
H. Mei, J. M. Campbell, C. M. Paddock, P. Lertkiatmongkol, M. W. Mosesson, R. Albrecht, P. J. Newman. "Regulation of Endothelial Cell Barrier Function by Antibody-driven Affinity Modulation of Platelet Endothelial Cell Adhesion Molecule-1 (PECAM-1)." Journal of Biological Chemistry 2014, 289, 30, 20836-44.
-
Y. Wei, Z. Wang, L. Su, F. Chen, P. Tejera, E. K. Bajwa, M. M. Wurfel, X. Lin, D. C. Christiani. "Platelet Count Mediates the Contribution of a Genetic Variant in LRRC16A to ARDS Risk." Chest 2015, 147, 3, 607-17.