The effects of computer simulation on students’ understanding of the particulate nature of matter
published: 17 May 2025 | https://doi.org/10.63174/xdi.NJSQ7250
Abstract
The particulate nature of matter is one of the core principles of chemistry, which helps students to recognize relevant chemical phenomena and chemical content at the submicroscopic level. Simulation describes the behavior and interactions of particles in a dynamic way, which helps students understand the particulate nature of matter by concretizing and visualizing abstractions. At the same time, simulations can be used as a useful resource or even a replacement for the authentic laboratory to deepen the grasp of abstract concepts. The purpose of this study was to explore the effect of simulation on understanding the particulate nature of matter through the use of an eye-tracking device. Thirty middle school students were divided into two groups. The experimental group watched an instructional video with simulation and the control group watched an instructional video except simulation. The results showed that students in the experimental group paid more attention to the conduct and interactions of the particles. And students in the control group paid more attention to the characters area, which was harder to extract and process applicable information, and will perform extra searching, localization and integration. The findings showed that simulations can increase students' attention to the particulates and help them to understand the particulate nature of matter.
1. Introduction
Chemistry is the science of matter and its transformations, so the concept of matter is crucial to chemistry. An appropriate grasp of matter determines the student's perception of the principles and theories of physical and chemical changes.[1,2] The capacity to symbolize matter at the particle stage is important for the interpretation of phenomena or chemical reactions, modifications of nation and gasoline laws, stoichiometric relationships and solution chemistry.[3] Because of this, the particulate nature of matter is one of the core concepts of science and a key factor of the science education curriculum at all degrees from upper elementary to secondary school.[4,5] At the same time, the particulate nature of matter is now not only the groundwork for students' understanding of many scientific concepts, such as the structure of matter, section transitions, diffusion, solvation processes, and solution chemistry, but it additionally approves students to visualize and make sense of any relevant scientific phenomenon at the submicroscopic level.[6,7,8,9] Improving students' appreciation of the particulate nature of matter could improves their understanding of scientific concepts, which in turn opens up the possibility of making use of the scientific concepts to problem solving.
To be aware of students' understanding of the particulate nature of matter, Novick and Nussbaum listed five aspects of the particulate model of gases.[10] de Vos and Verdonk gave an eight-point description of the particulate nature of matter in science education via inspecting preceding literature.[6]
In addition, the model and learning progress of students' understanding of the particulate nature of matter has also been examined. Andersson categorizes Swedish students' understanding of particulate nature of matter into five modes of understanding, namely disappearance, displacement, modification, transformation, and chemical interactions, which in part reflects students' pathways to developing the particulate nature of matter.[11] Johnson conducted a three-year study with students in grades seven through nine, using interviews as a way to learn about possible models of particulates of matter that students might have, and the study found several models, namely model X, model A, model B, and model C.[12] Hadenfeldt et al. summarized research published between 2003 and 2012 on students' understanding of the concept of matter and found that different studies delineated different levels of progression, and compared and integrated the levels of progression of the different studies to obtain a “basic” model with four dimensions, described with five levels was developed to describe students' understanding.[13]
However, both students, pre-service instructors and in-service instructors have some difficulties in understanding the particulate nature of matter.[6,7,8] This is mainly due to the abstract nature of atoms and molecules, lack of suited visualization, two-dimensional presentations in textbooks, and teachers' incapability to explain and advance appropriate instructional substances.[14,15,16,17] In response to these reasons, some new learning theories and methods have been brought into the classroom, such as multiple representations, conceptual shifts, and computer-assisted (including animations, simulations, etc.), with a view to enhancing students' understanding of the particulate nature of matter.
The purpose of this study was to investigate the effects of simulation on students' attention distribution, cognitive load, and understanding of the particulate nature of matter. Therefore, the purpose of this study was to investigate the following questions:
(1) Does simulation help students understand the particulate nature of matter?
(2) Does simulation affect students' attention allocation and cognitive load?
1.1 Simulations
Learning for the submicroscopic level normally requires the use of models and imagination.[18] Animations and simulations provide students with a way to visualize the motion and interactions of particles.[19,20] In contrast to static images, simulations can show dynamic processes and adjust the dynamic processes shown as needed. This enhances students' capability to visualize particle processes at the submicroscopic level, helps students visualize abstract scientific models, connects representations of scientific phenomena at all three levels, develops advanced conceptual understanding at the particle level, and creates a positive attitude toward studying.[17,21,22,23] At the same time, using these materials in the study room can help students better strengthen mental models of particle conduct.[24,25]
In contrast to other approaches, students can interact with simulations as an experimental tool. The interaction allows students to manipulate and observe the corresponding phenomena at the macroscopic and submicroscopic levels, enabling them to explore complex chemical phenomena and chemical representations at the submicroscopic, symbolic and macroscopic levels. These features foster stronger connections between macroscopic, submicroscopic, and symbolic representations and promote students' comprehensive understanding of the particulate nature of matter. Thus, this study chose simulation to explore its impact on students' understanding of the particulate nature of matter.
There is a growing physique of research on the use of simulations in science education. For example, Stieff[26] compared the effects of an Internet chemistry course using simulations and instructor lectures on students' representational capabilities and conceptual understanding; Olakanmi[27] explored the effects of simulations on students' conceptual perception and attitudes toward chemical reaction rates; Tang et al. [17] compared the effects of simulations with different degrees of illustration on students' appreciation of the particulate nature of matter; Sweeder et al. [28] compared the effects of simulations and screen recordings using the identical simulations on students' grasp of kinetic concepts.
The subject of the galvanic cell was chosen for this study. Electrochemistry is an essential part of chemistry education and the galvanic cell is one of the fundamental principles of electrochemistry. At the same time, electrochemistry has long been recognized as one of the most challenging topics in high school chemistry courses[29]. On the one hand, due to the fact the subject involves the concepts of electricity and redox, both of which are very challenging.[30] On the other hand, most electrochemical processes are not visible to students, and it is difficult for students to visualize what is happening at the submicroscopic level and relate it to the macroscopic and symbolic level, which may additionally lead to different concepts.[31] Simulations can make invisible chemical processes and abstract chemical concepts visible, helping students understand the dynamic process of the movement of electrons and other charged particles in the primary cell, supporting students to better understand the concept of the primary cell at a submicroscopic level, which in turn helps them understand the particulate nature of matter.
1.2Cognitive load theory and measurement
Cognitive load theory, also recognized as limited resource theory, is a theoretical construct that describes the organization of human cognition. It hypothesizes that the composition of the human cognitive framework is primarily based on the existence of working and long-term memory. Cognitive load is positively associated to the amount of information that desires to be processed.[32] The cognitive load experienced by students during the learning process is drastically influenced by the studying substances furnished with the aid of the teacher and the extent to which these substances are applicable to the students' studying experience.[33] Therefore, how to minimize cognitive load in teaching practice has grown to be an difficulty to be regarded in chemistry education.
Measuring cognitive load can assist to better minimize cognitive load. Existing assessments of cognitive load are primarily based on mental load and encompass subjective assessments, task measures, and physiological indicators.[34] Subjective evaluation measures assume that people are able to reflect on their cognitive processes and report the quantity of mental effort expended. This study used the NASA-TLX scale to understand participants' subjectively assessed cognitive load. Physiological indications measurements assume that modifications in cognitive load will reason changes in sure physiological signs. Relevant physiological indications can be measured thru technical techniques such as EEG and eye tracking. Pupil dilation has been discovered to be a physiological marker of the degree of "thinking intensity". This is because pupils have a tendency to dilate more in conditions of heightened cognitive processing.[35] This learns about used eye-tracking technological know-how to recognize the participants' pupil diameter during the studying manner to assess their cognitive load.
1.3 Eye-tracking technology
Based on the eye-mind hypothesis, eye-tracking techniques are in many instances used to detect visual attention in human beings.[36] In gaining knowledge of research, eye-tracking techniques have acquired a good deal attention for their ability to provide prosperous statistics about learners' cognitive processes. This method has been extensively used to study a number cognitive processes such as reading processing and problem solving. Eye-tracking techniques have additionally been used to study learning processes. However, in the current study, it is still unknown whether simulation will have an effect on students' cognitive processes. Thus, with the help of eye tracking technology, this study investigates whether simulation has an effect on students' cognitive processes by analyzing eye movement data.
Common metrics of eye movements include fixation time, sweep amplitude, pupil diameter, heat map, and eye movement trajectory map. In the present study, we used the indicators of fixation time, number of fixations, number of saccades, and pupil diameter to understand the differences in interest allocation and cognitive load between the two groups of participants during the experiment.
2. Methods
2.1 Participants and design
Senior high school students from a general high school in China participated in this study (total number of participants was 30, of which 19 were female; arithmetic mean of age was 15.95, standard deviation of age was 0.40, and age range was 14-16 years). All participants had normal or corrected-to-normal vision and hearing. They all gave written informed consent. Participants were paid a fee at the end of the study.
This study was divided into a control group and an experimental group based on whether or not the video lectures used simulations. Prior to the start of the study, participants were assigned to one of the groups for the experiment based on their usual academic performance and academic grades, and it was ensured that there was no significant difference in the academic levels of the two groups of students. A total of 15 participants in each group conducted the experiment.
2.2 Instrumentation and data analysis
Participants' eye movements were recorded by an Eyelink 1000 Plus eye-tracking device with a sampling frequency of 2000 Hz. The video lectures were conducted on a screen with a resolution of 1024*768 pixels. Participants sat 60 cm from the screen to watch the video lectures. A nine-point calibration and validation procedure was used to confirm the accuracy of the eye-tracking. The collected data were filtered to find out the required data and counted in Excel and analyzed in SPSS 26.0.
There are two areas of interest (AOIs) in the video course(Figure 1): the Characters Area AOI and the Particulate Area AOI. The Characters Area AOI presents the knowledge to be taught in this lesson in the form of text. The Particulate Area AOI demonstrates the behavior and interactions of particles. The Characters Area AOI and Particulate Area AOI of two groups are the same size.
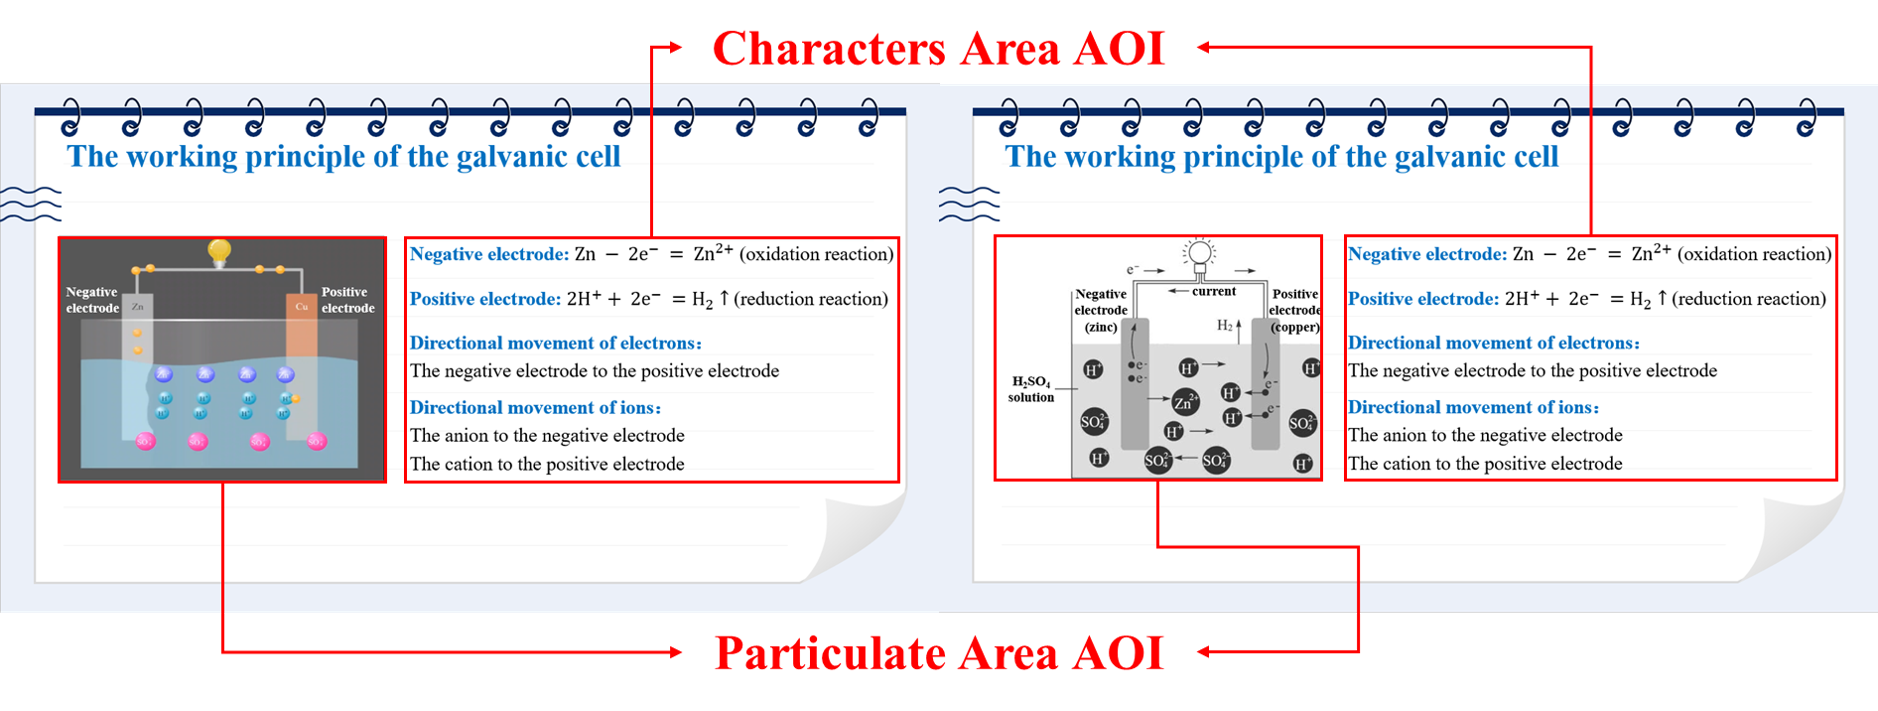
Figure 1 AOI schematic (experimental group on the left and control group on the right).
2.3 Experimental materials
2.3.1 Video lectures
The topic of the video lectures is galvanic cells. The same content is given in both videos. An example of a copper-zinc galvanic cell is used to illustrate the principle of the galvanic cell. The difference between the two videos is the presentation of the Particulate Area AOI. The Particulate Area AOI of the experimental group shows the behavior and interaction of particles dynamically using simulations, while the Particulate Area AOI of the control group shows the process statically using pictures. The simulation used by the experimental group from the NOBOOK. Both videos have the same duration of about six minutes.
2.3.2 Learning performance test
The learning performance test was based on the scale developed by Huanhuan Lu,[37] and the test questions were abridged according to the actual situation of the students. The test questions were used to know the students' understanding of the knowledge of galvanic cells after the learning process. The test questions consisted of eight multiple-choice questions (totaling 24 points) and two short-answer questions (each with a different score, totaling 14 points), with a total score of 38 points.
2.3.3 Cognitive load scale
This study used the NASA-TLX scale to measure participants' cognitive load during the learning process.[38] The scale consists of six dimensions containing psychological demands, physical demands, time demands, effort level, performance level, and frustration level. The scale is divided into two parts; the first part is a two-by-two comparison of the six dimensions to determine the weights of the dimensions; the second part is a rating of the six dimensions. The final cognitive load score was a weighted average of the six dimensions.
2.4 Experimental procedure
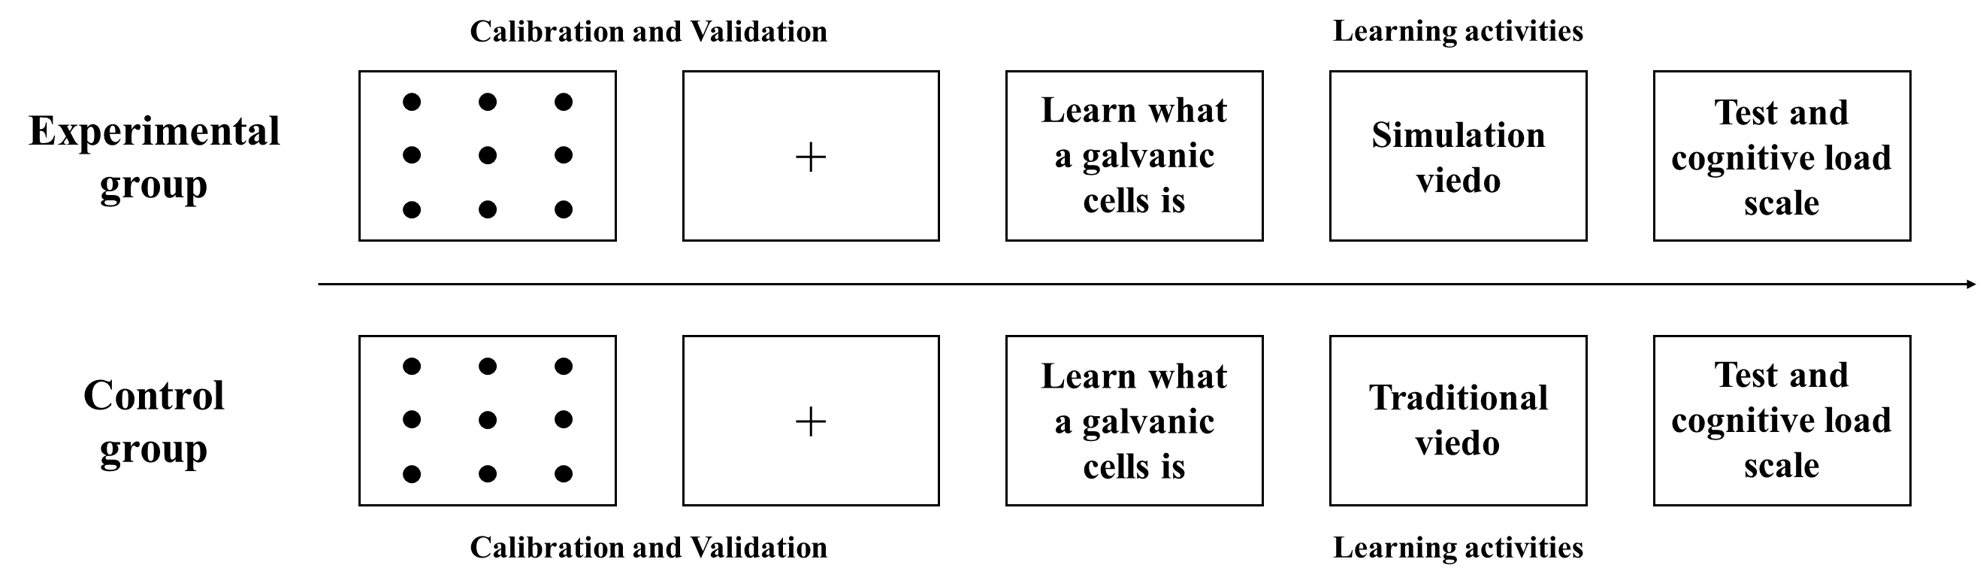
Figure 2 Experimental procedure.
Participants completed the experiment individually in the laboratory and were informed of the experimental procedure before the start of the experiment (Figure 2). First, the eye-tracking device was calibrated using a nine-point calibration. After the calibration, start watching texts, pictures and video lectures to learn. Participants will first learn about the galvanic cell and its components by reading texts and pictures. Afterwards, watch the corresponding video lectures according to the group to understand the principle of the galvanic cell, and the eye tracking device recorded the participants' eye movements during video lectures. Finally, participants completed the Learning Performance Test and Cognitive Load Scale immediately after viewing the video. Participants spent approximately 30 minutes completing the experiment.
3. Results
3.1 Learning performance
As shown in Figure 3, the experimental group scored higher on the learning performance test (M = 24.00, SD = 6.81) than the control group (M = 17.77, SD = 8.86).
The independent samples t-test showed that there was a significant difference between the scores of the two groups on the learning performance test (t(28) = 2.159, p = 0.040 < 0.05, Cohen's d = 0.82).
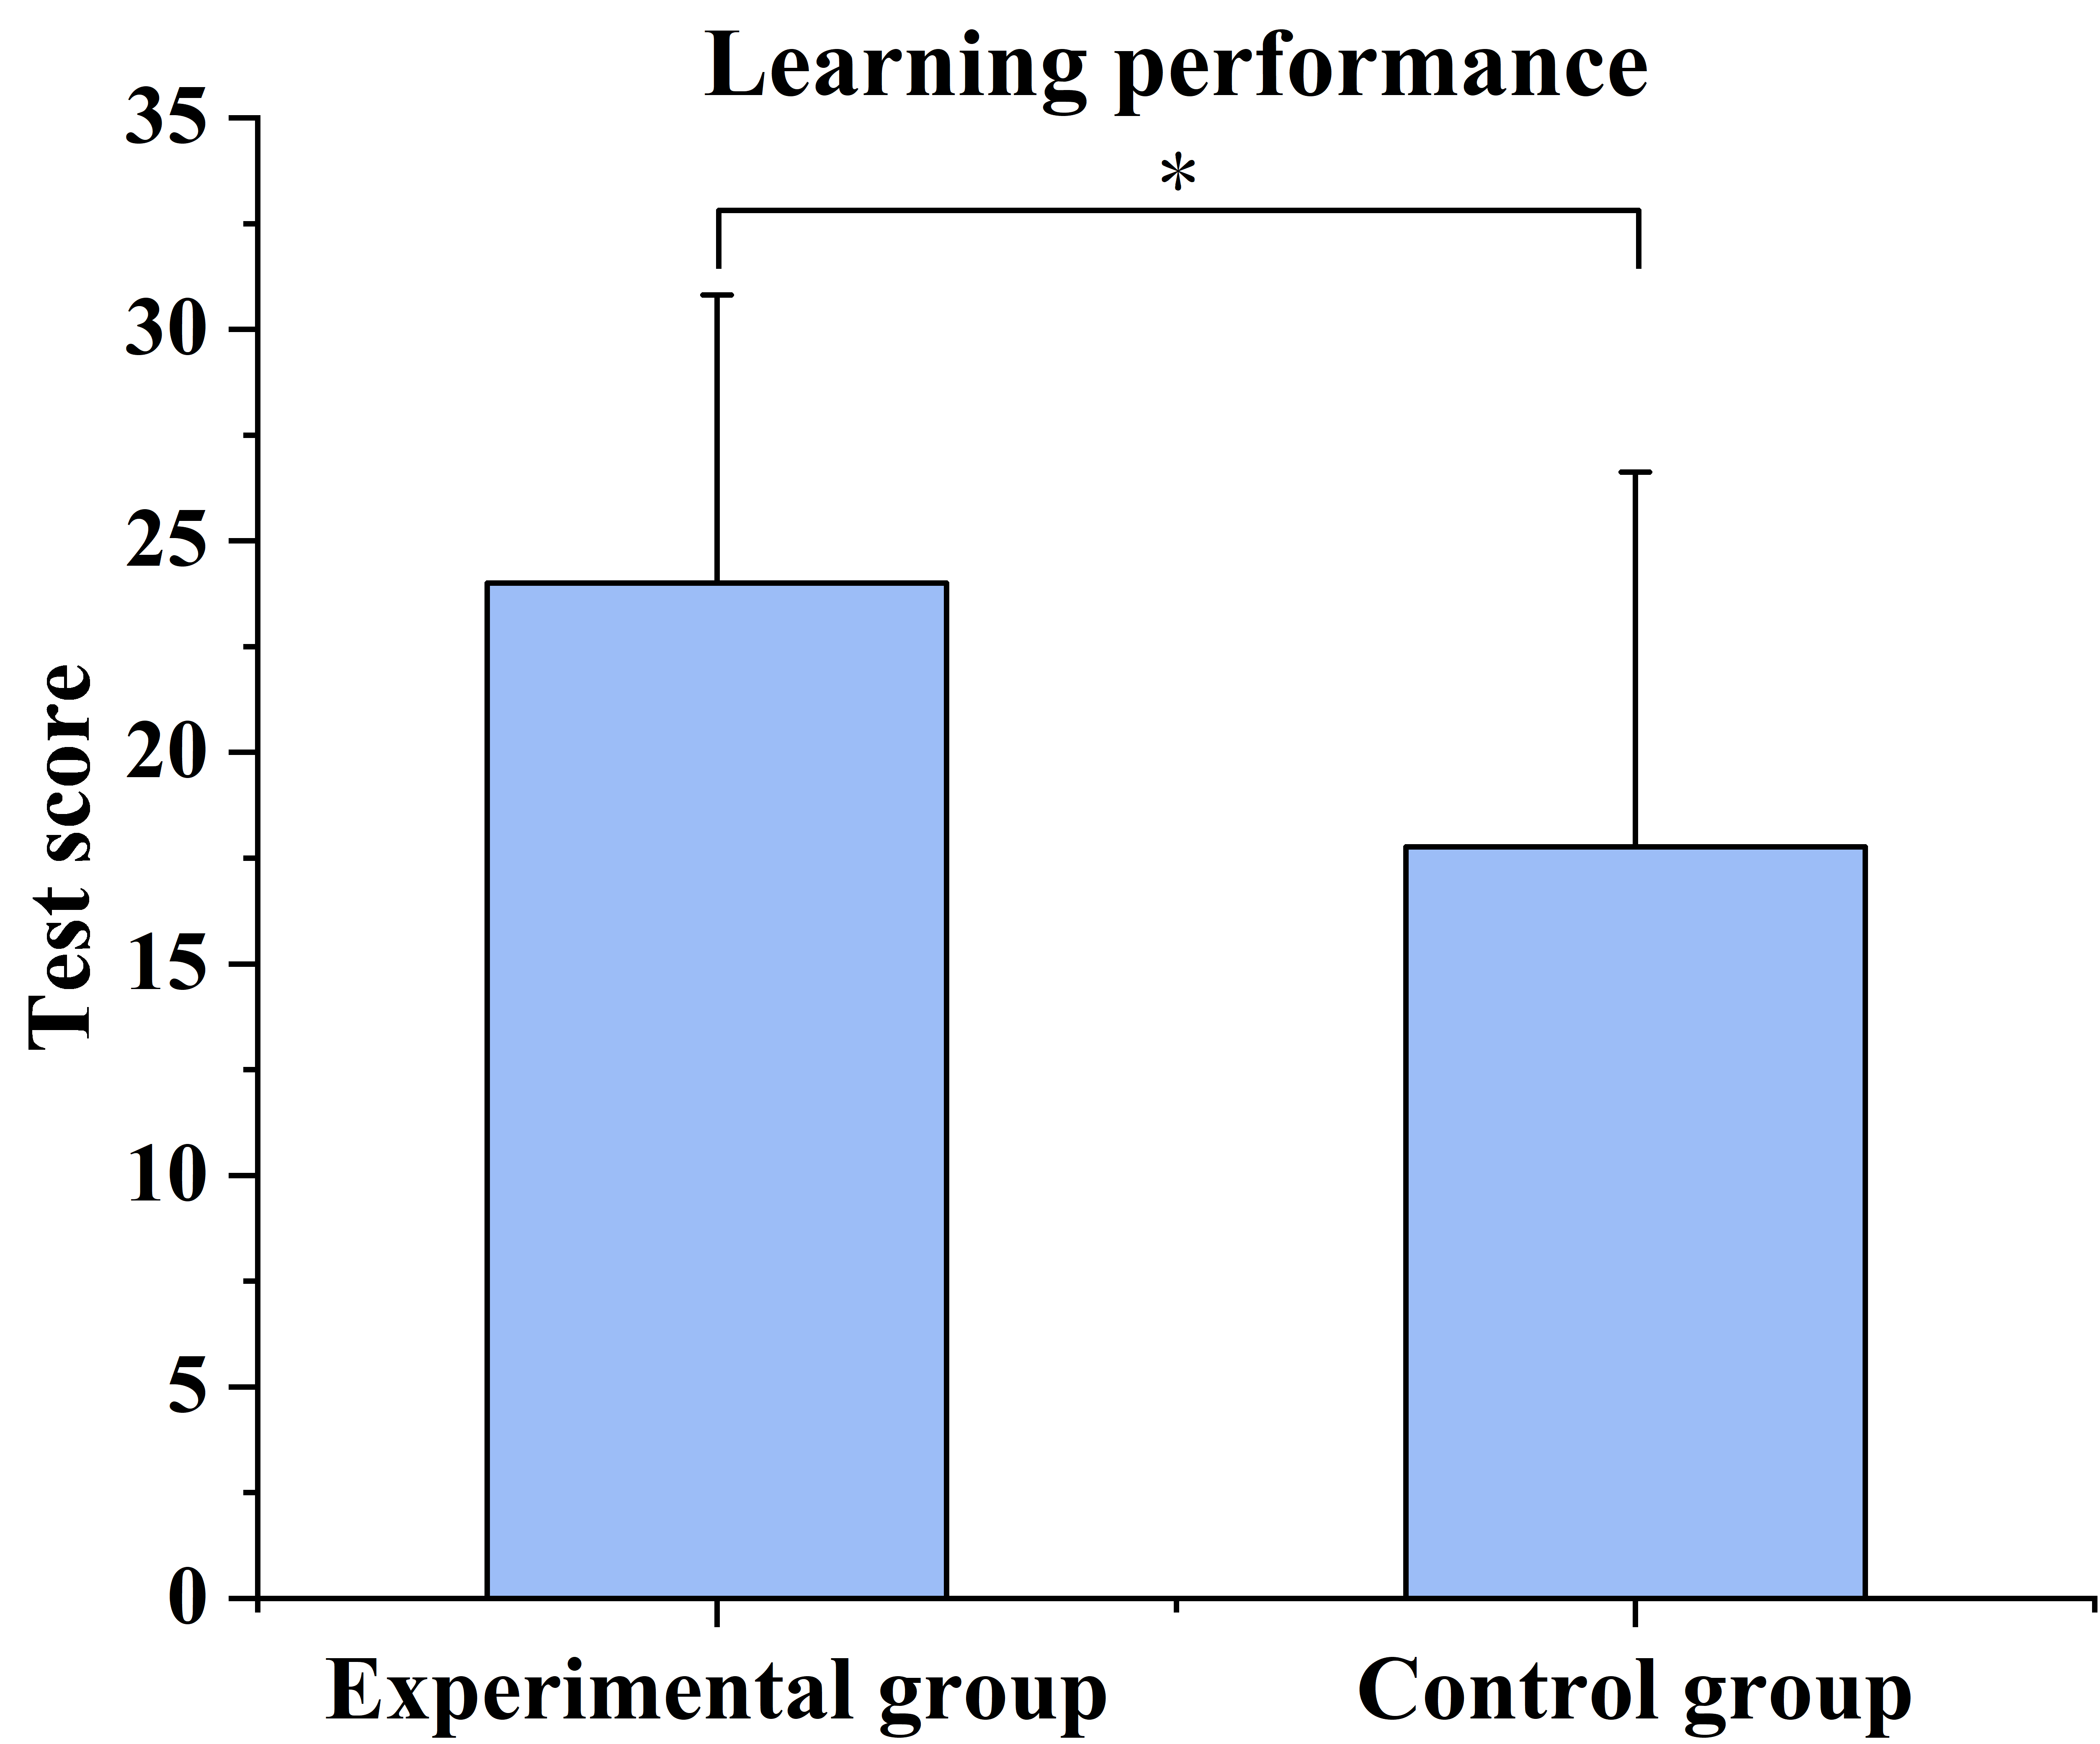
Figure 3 Learning performance test score of experimental and control group(*p<0.05).
3.2 Attention distribution
In this study, the video course was divided into two areas of interest (AOI), i.e., the characters area AOI and the Particulate Area AOI. The indicators of Fixations time of AOI, the number of fixations of AOI, and the number of saccades of AOI were chosen to understand the participants’ attentional distribution during the learning process, and then to understand the participants’ cognitive mechanisms.
3.2.1 Fixations time of AOI
As shown in Figure 4, the experimental group’s fixations time for the Particulate Area AOI (M=175.03, SD=45.07) was more than that of the control group (M=109.84, SD=40.14), and the experimental group’s fixations time for the characters area AOI (M=97.95, SD=24.77) was less than that of the control group (M=137.33, SD=40.36).
The independent samples t-test showed that there was a significant difference between the two groups’ Fixations times for the Particulate Area AOI (t(28)=4.183, p=0.000<0.001, Cohen’s d=1.58), and there was a significant difference between the two groups’ fixations times for the characters area AOI (t(28)=3.221, p=0.003<0.01, Cohen’s d=1.22).
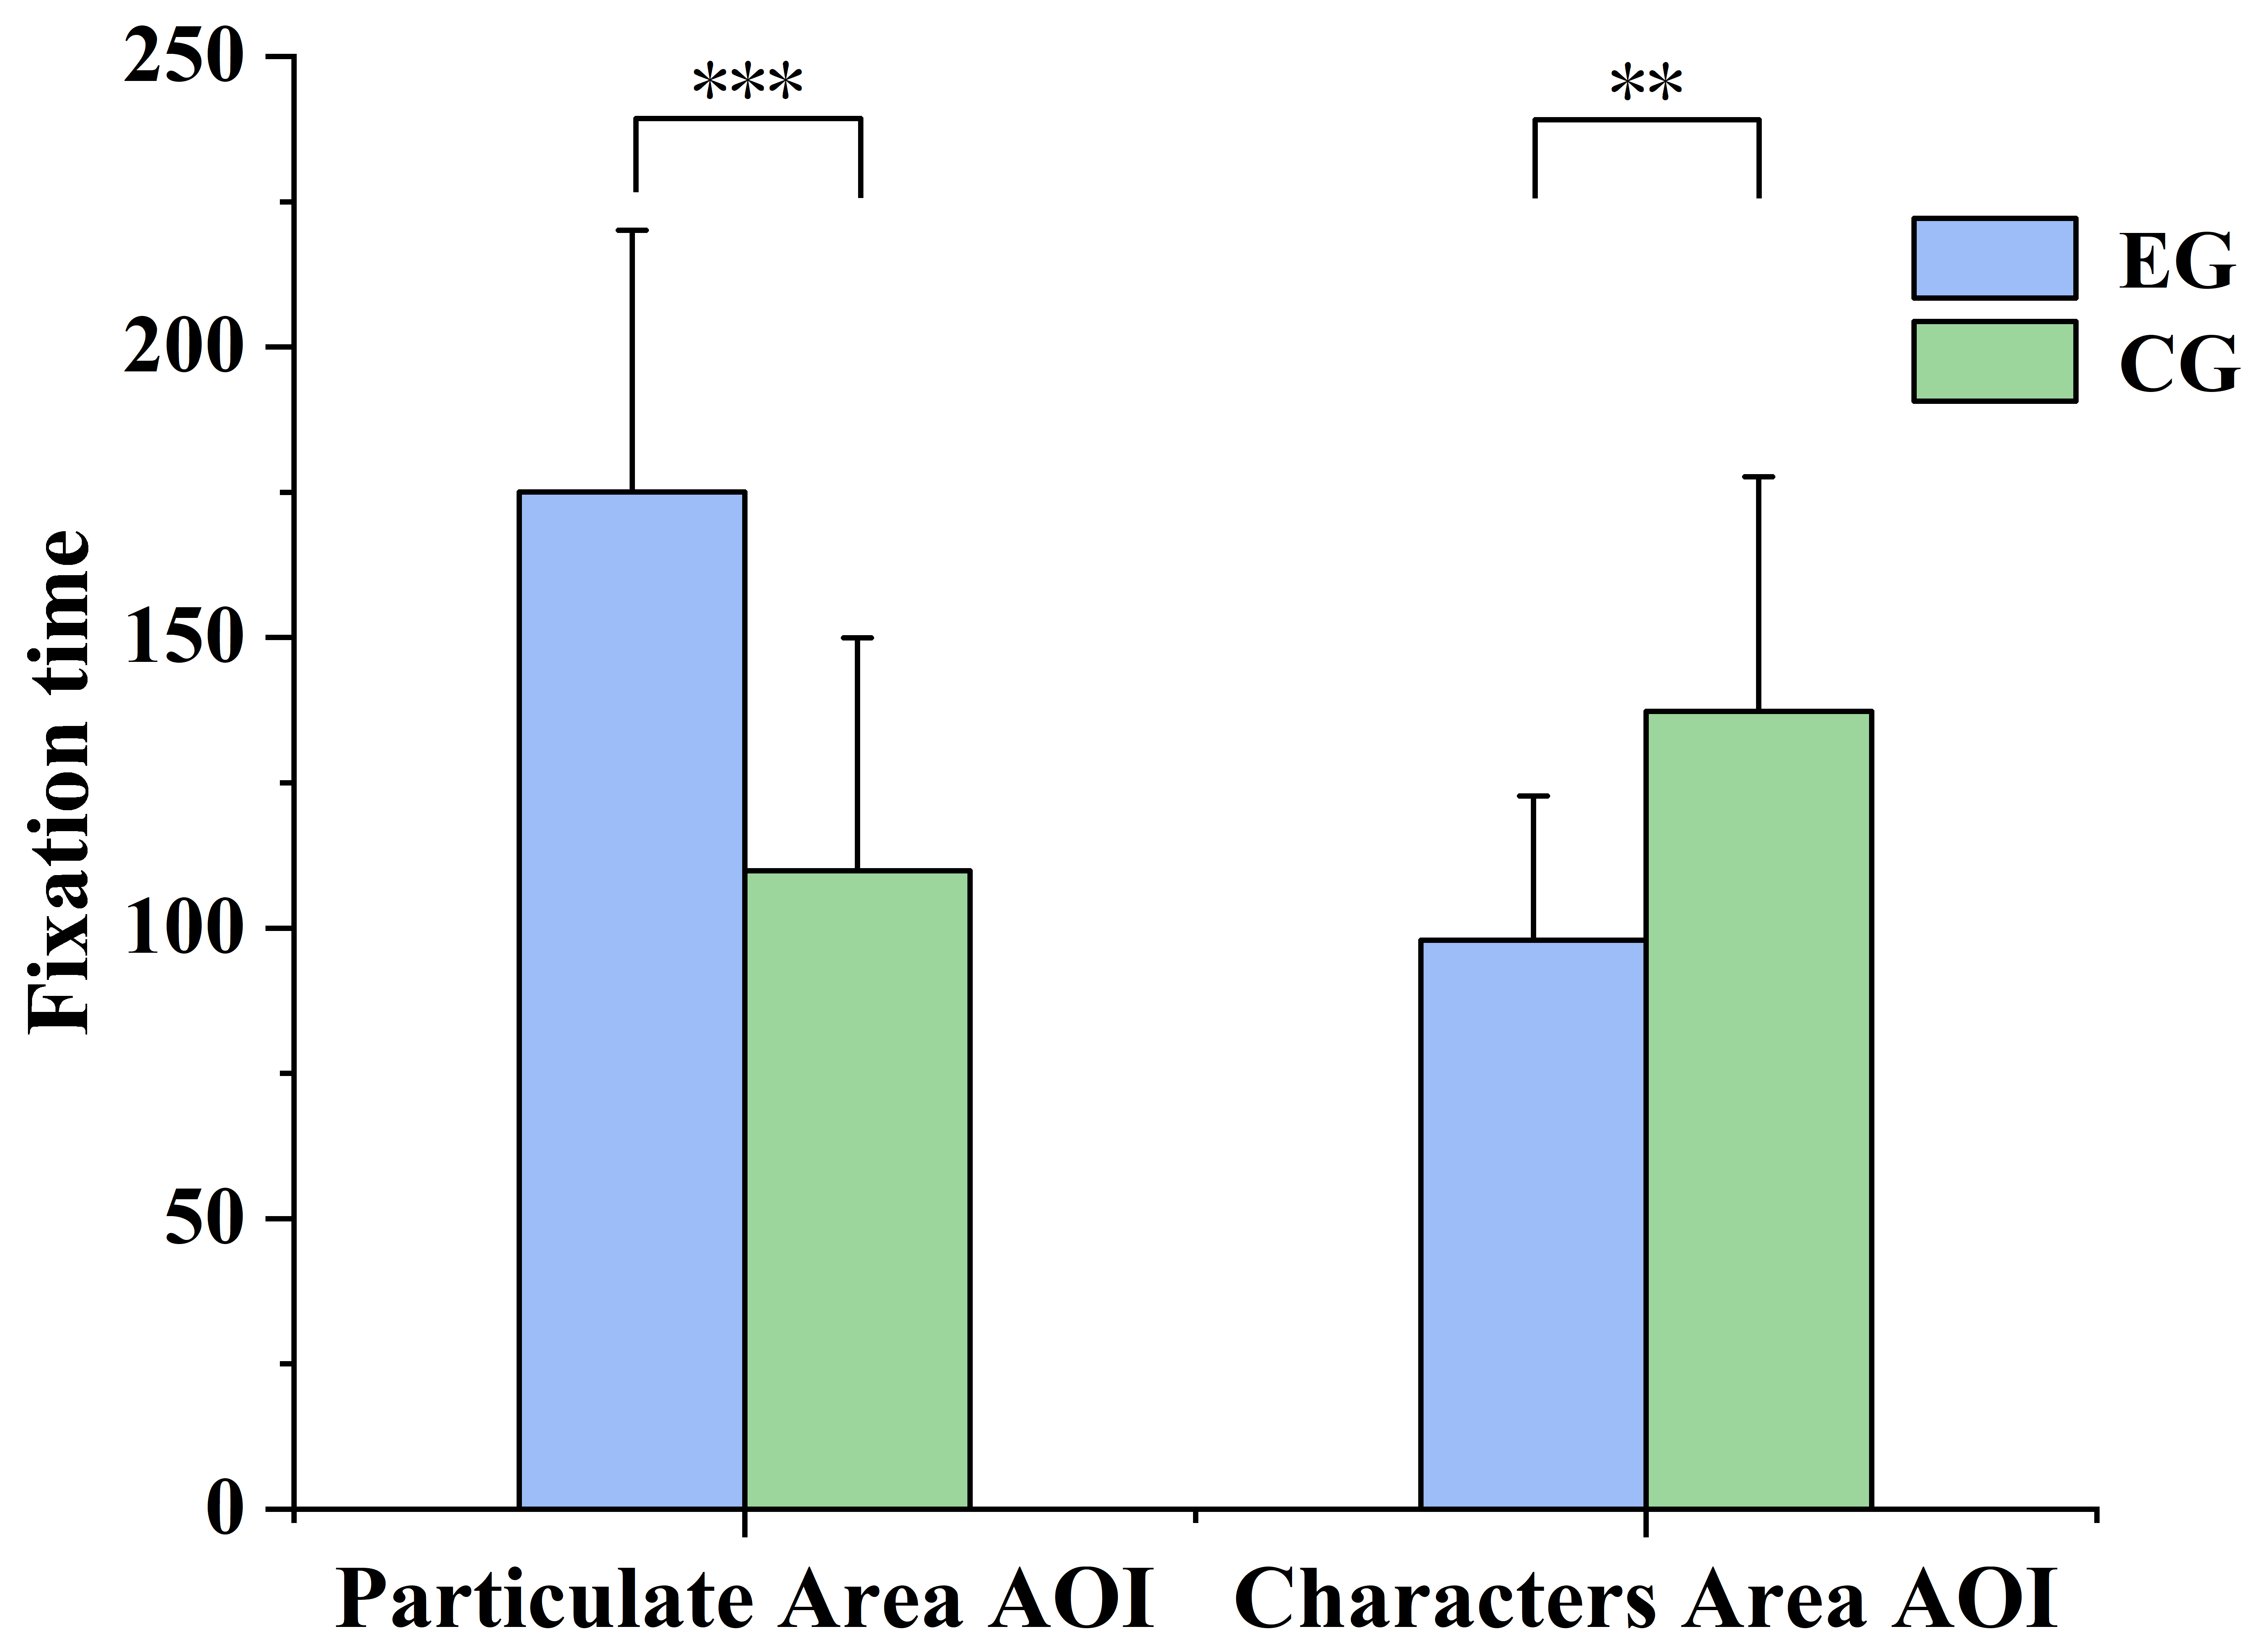
Figure 4 Different AOI fixation time of experimental group(EG) and control group(CG) (**p<0.01, ***p<0.001).
3.2.2 The number of fixations of AOI
As shown in Figure 5, the experimental group had a bigger number of fixations to the Particulate Area AOI (M=427.40, SD=118.63) than the control group (M=341.47, SD=89.60), and the experimental group had a smaller number of fixations to the characters area AOI (M=314.47, SD=103.32) than the control group (M=475.00, SD=109.36).
The independent samples t-test showed that there was a significant difference between the two groups in the number of fixations to the Particulate Area AOI (t(28)=2.239, p=0.033<0.05, Cohen’s d=0.85) , and a significant difference between the two groups in the number of fixations to the characters area AOI (t(28)=4.133, p=0.000<0.001, Cohen’s d=1.56)..
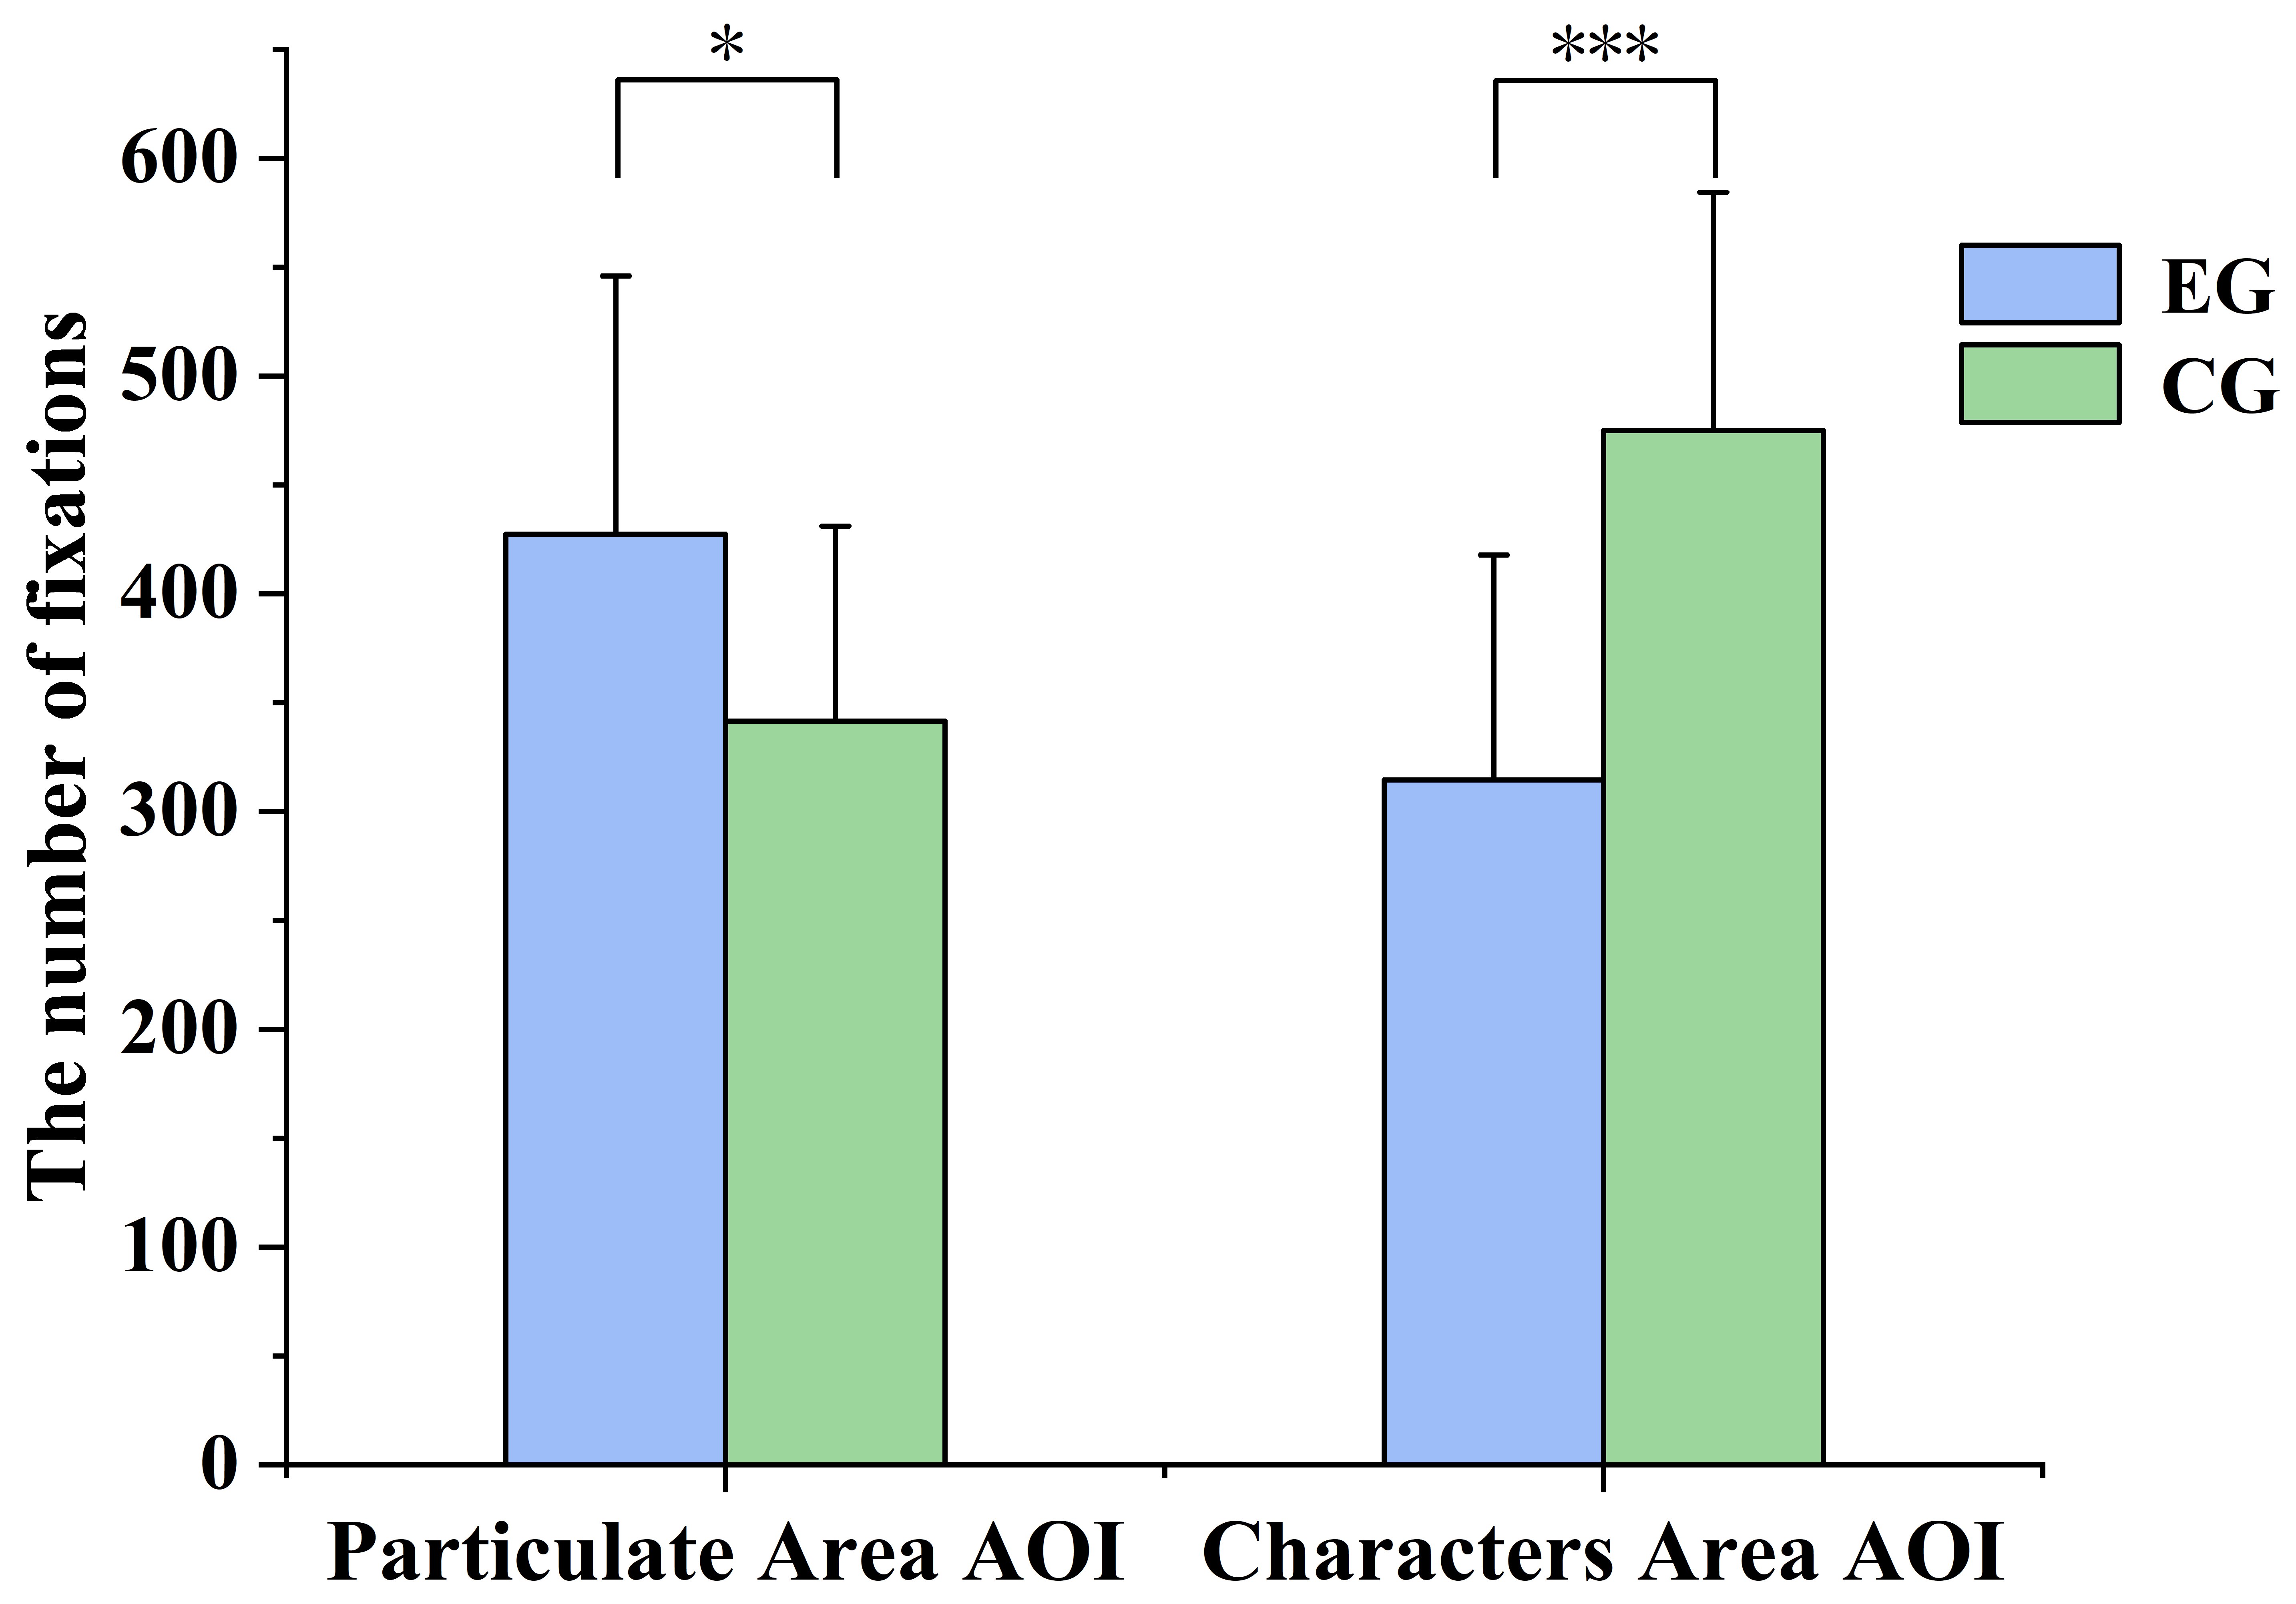
Figure 5 The number of fixations of different AOI of experimental group(EG) and control group(CG) (*p<0.05, ***p<0.001).
3.2.3 The number of saccades of AOI
As shown in Figure 6, the number of saccades of the Particulate Area AOI in the experimental group (M=50.47,SD=13.86) was less than that of the control group (M=69.73,SD=18.58), and the number of saccades of the characters area AOI in the experimental group (M=63.87,SD=15.65) was less than that of the control group (M=95.33,SD=21.88).
The independent samples t-test showed that there was a significant difference in the number of saccades of the Particulate Area AOI between the two groups (t(28)=3.219, p=0.003<0.01, Cohen’s d=1.22), and a significant difference in the number of saccades of the characters area AOI between the two groups (t(28)=4.530, p=0.000<0.001, Cohen’s d=1.71).
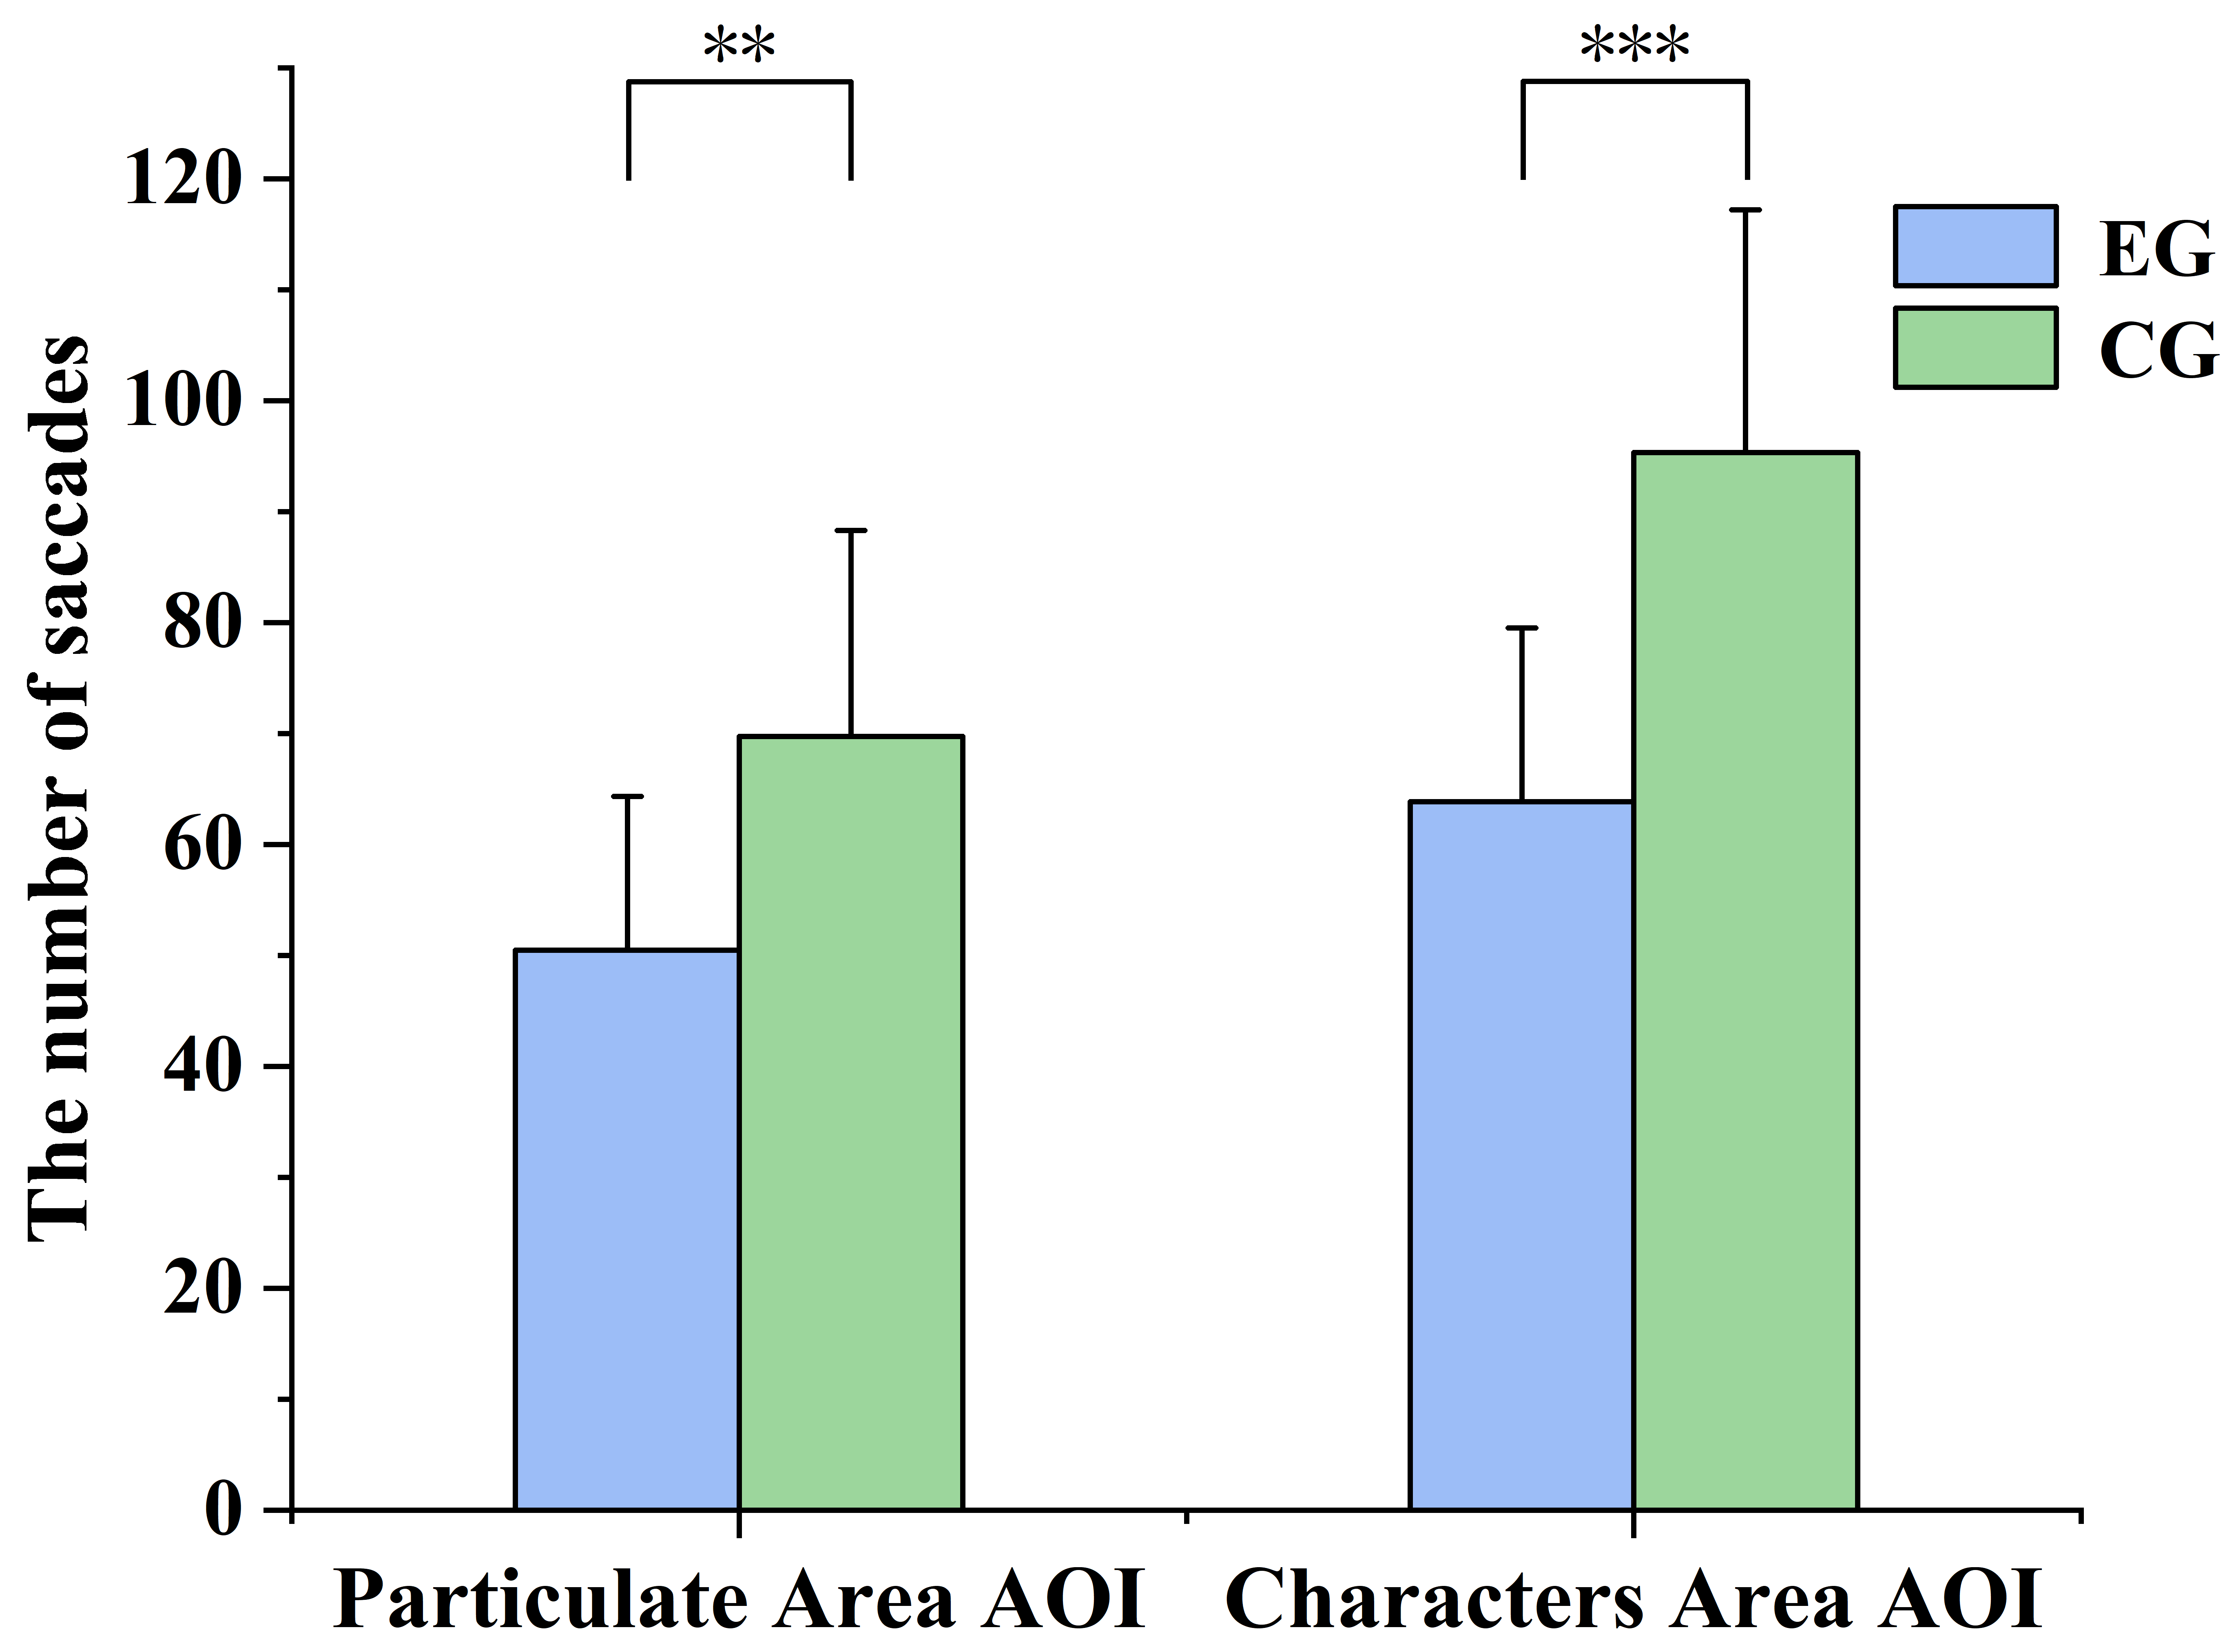
Figure 6 he number of saccades of different AOI of experimental group(EG) and control group(CG) (**p<0.01, ***p<0.001).
3.3 Cognitive load
In order to understand the cognitive load of the participants in the learning process, both subjective assessment and physiological measurements were chosen for this study. The subjective assessment was the cognitive load scale score completed by the participants at the end of the experiment. Physiological measurements were used an eye-tracking device to know the size and alterations in the participant's pupil diameter over the course of the experiment.
3.3.1 Cognitive load scale score
As shown in Figure 7, the experimental group scored less on the cognitive load scale (M=53.16, SD=14.03) than the control group (M=71.71, SD=14.28).
The independent samples t-test showed that there was a significant difference in the scores of the cognitive load scale between the two groups (t(28)=3.591, p=0.001<0.01, Cohen’s d=1.36).
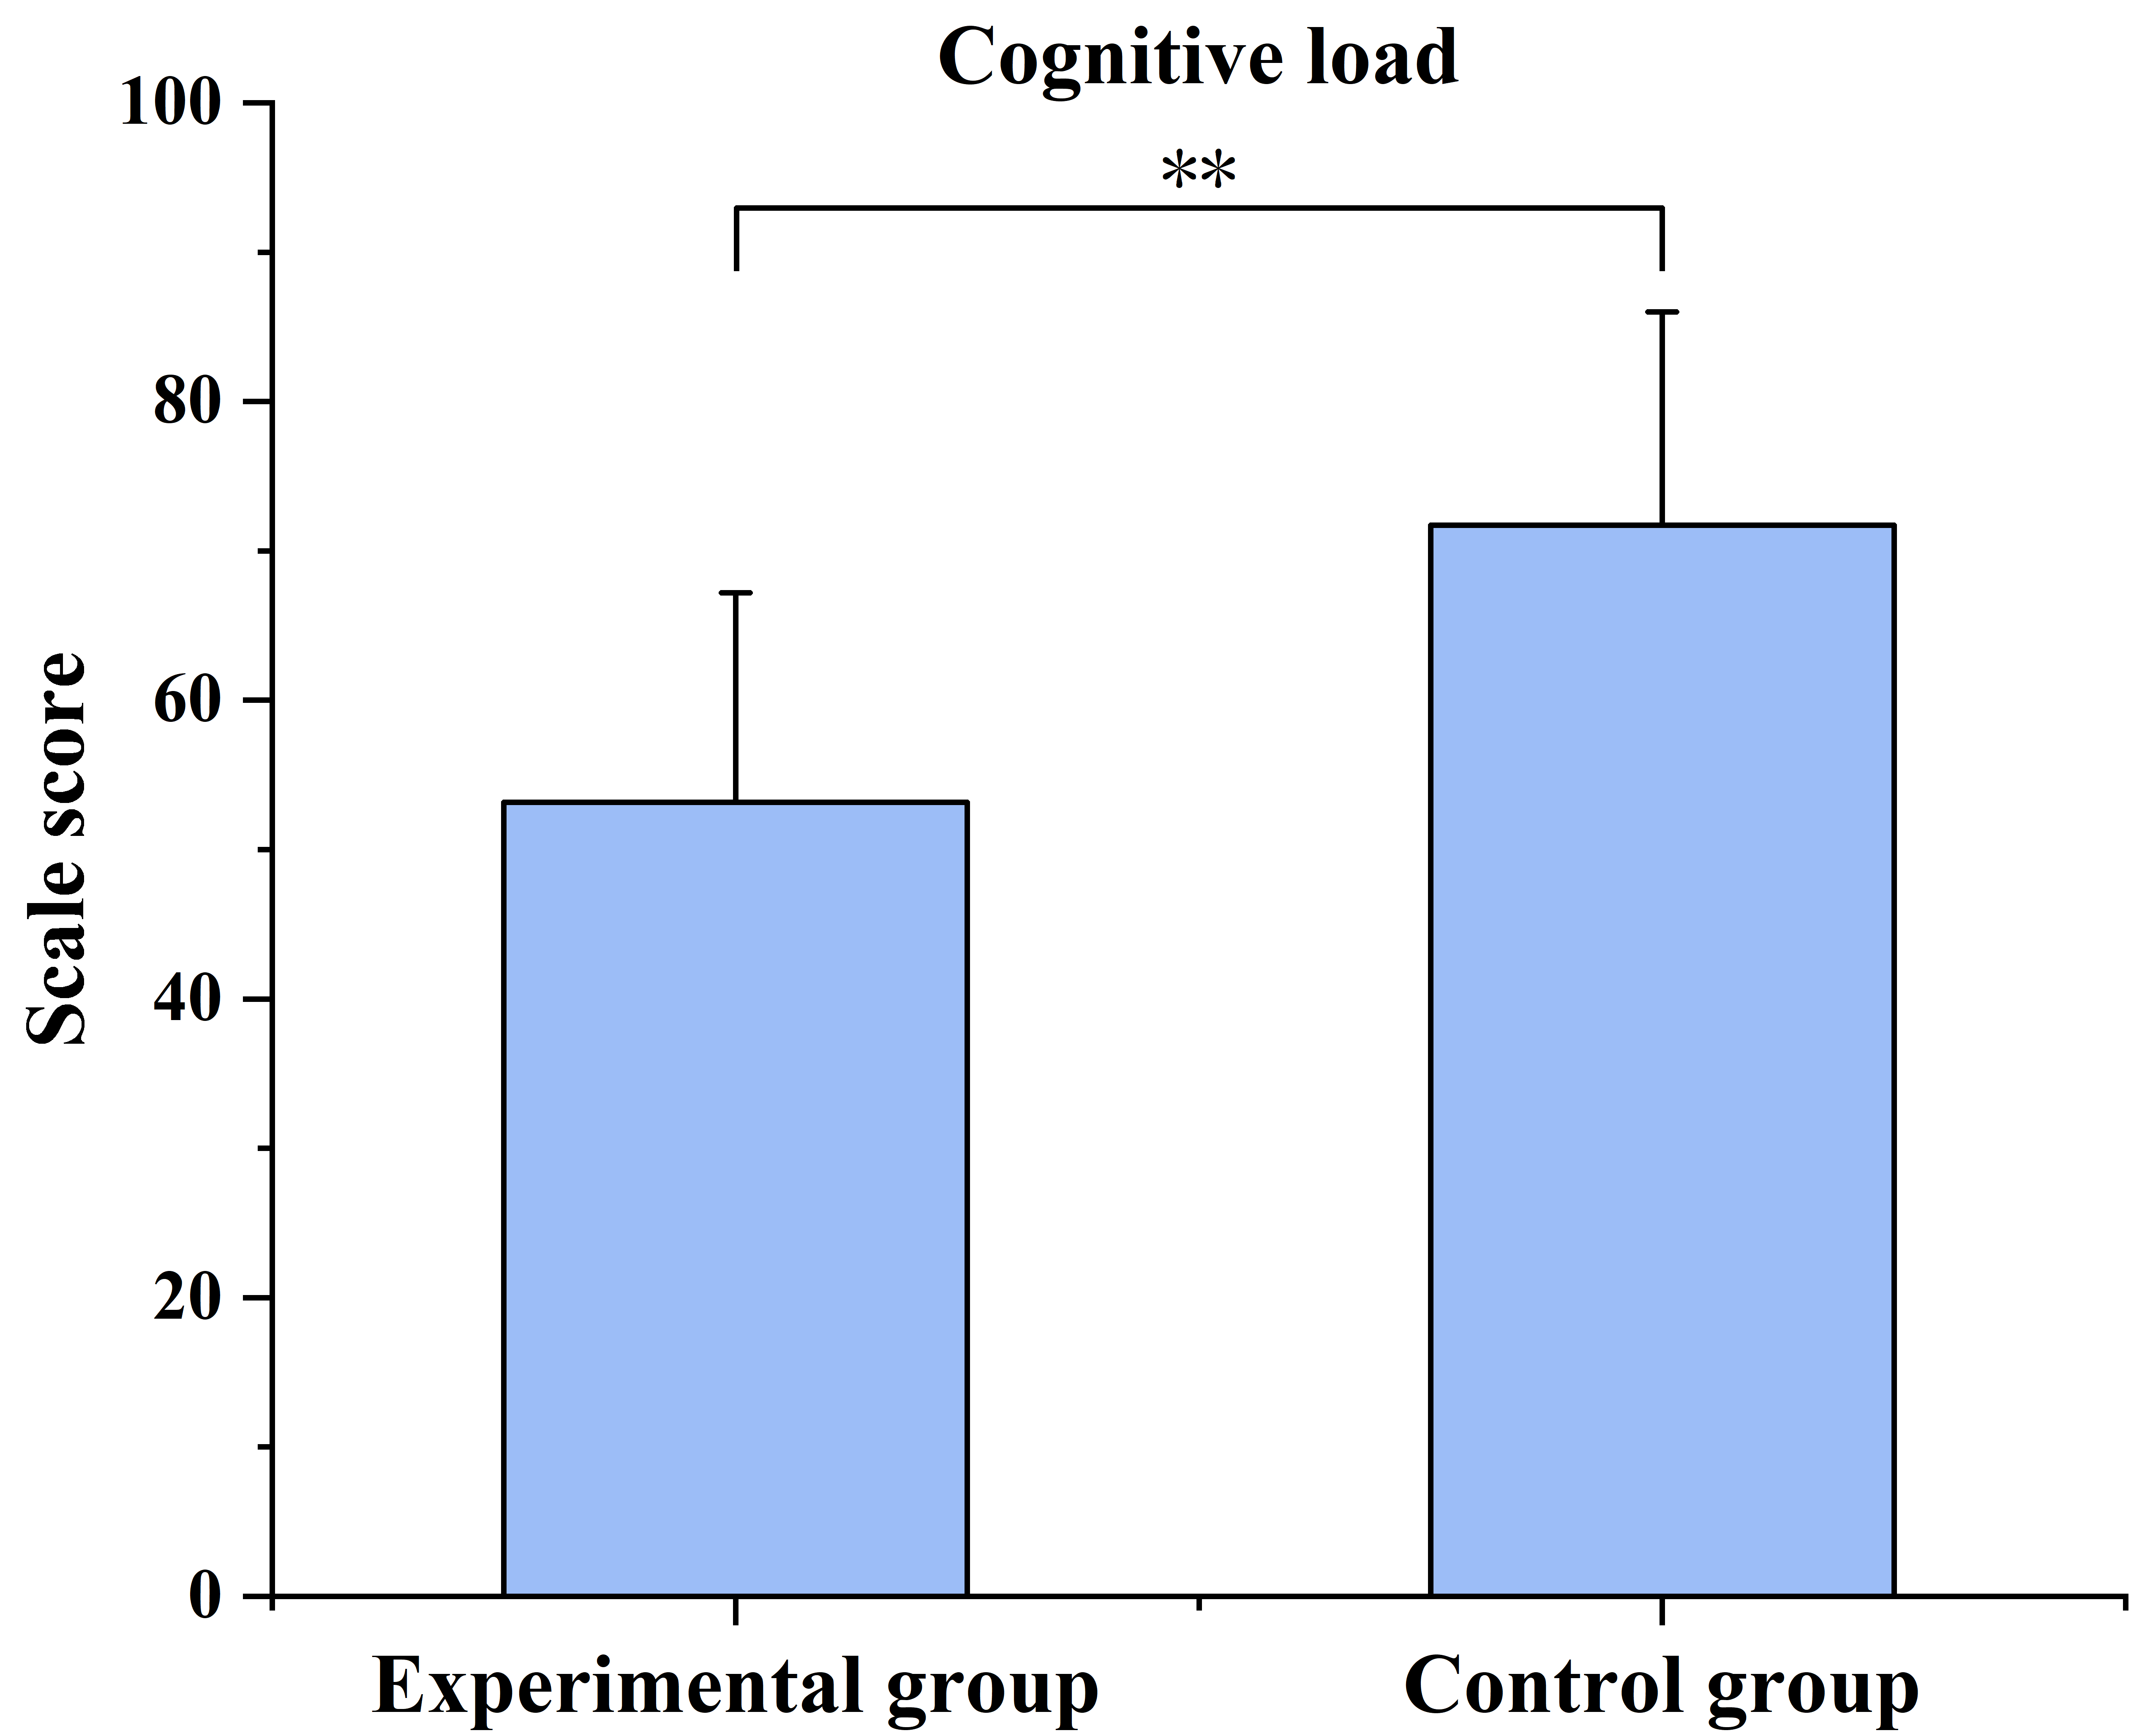
Figure 7 Cognitive load scale score of experimental and control group(**p<0.01).
3.3.2. Pupil diameter
As shown in Figure 8, the size of pupil diameter of the experimental group (M=3.00, SD=0.44) was smaller than that of the control group (M=3.53, SD=0.37), the alteration of pupil diameter of the experimental group (M=0.91, SD=0.23) was smaller than that of the control group (M=1.34, SD=0.27).
The independent samples t-test showed that there was a significant difference between the size of pupil diameter of the two groups (t(28)=3.580, p=0.001<0.01, Cohen’s d=1.35), and a significant difference between the alteration of pupil diameter of the two groups (t(28)=4.600, p=0.000<0.001, Cohen’s d=1.77).
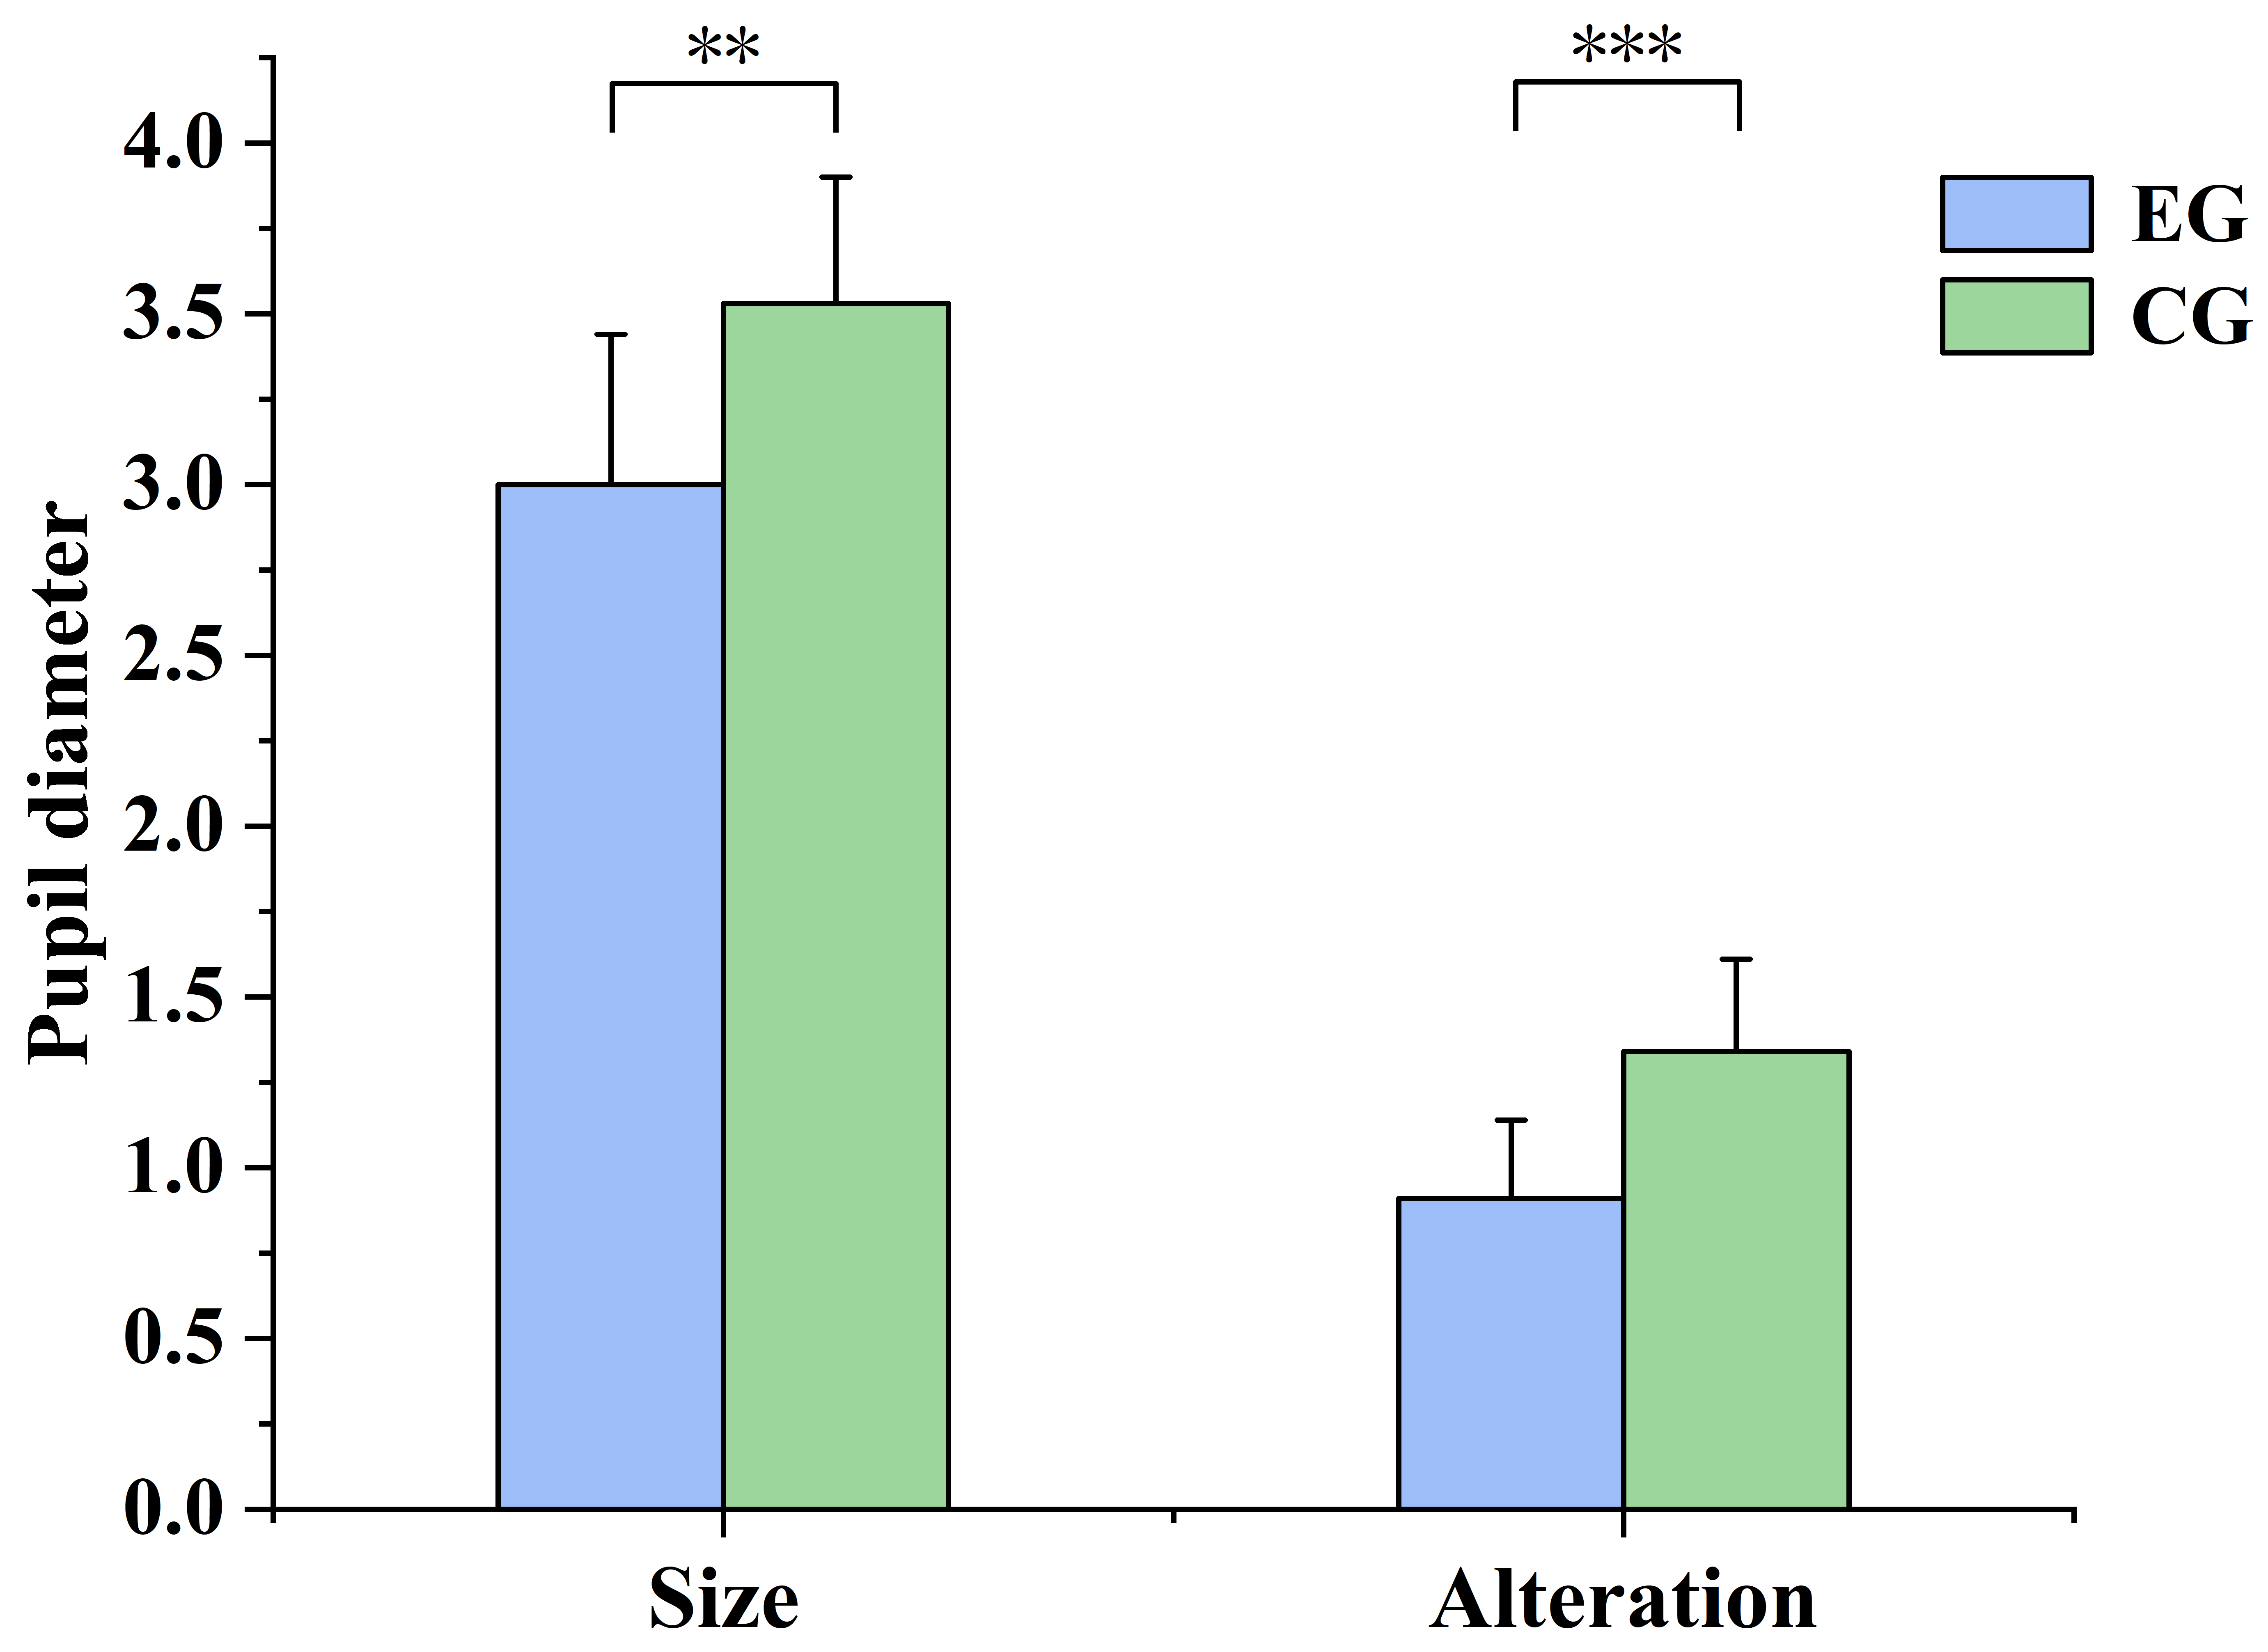
Figure 8 Size and alteration of pupil diameter during learning of experimental group(EG) and control group(CG) (**p<0.01, ***p<0.001).
3.4 Heat map
The coloration of the heat map changes from green to yellow and red, with red representing the best degree of interest to the location. Heat maps can visually characterize a subject's attention to a test item, showing an individual's cognitive load. The heat map can also mirror the learner's region of interest. As can be viewed in Figure 9, the red color suggests the region with the most targeted attention or the region with the longest attention time, followed by means of the yellow color, and the green color suggests the place with the least or shortest attention.
The experimental group spent more time on the Particulate Area AOI, had a deeper depth of cognitive processing, and tended to understand the concepts by way of moving and interacting from the particles; the control group spent more time on the Characters Area AOI, had a deeper depth of cognitive processing, and tended to understand the concepts from the text.
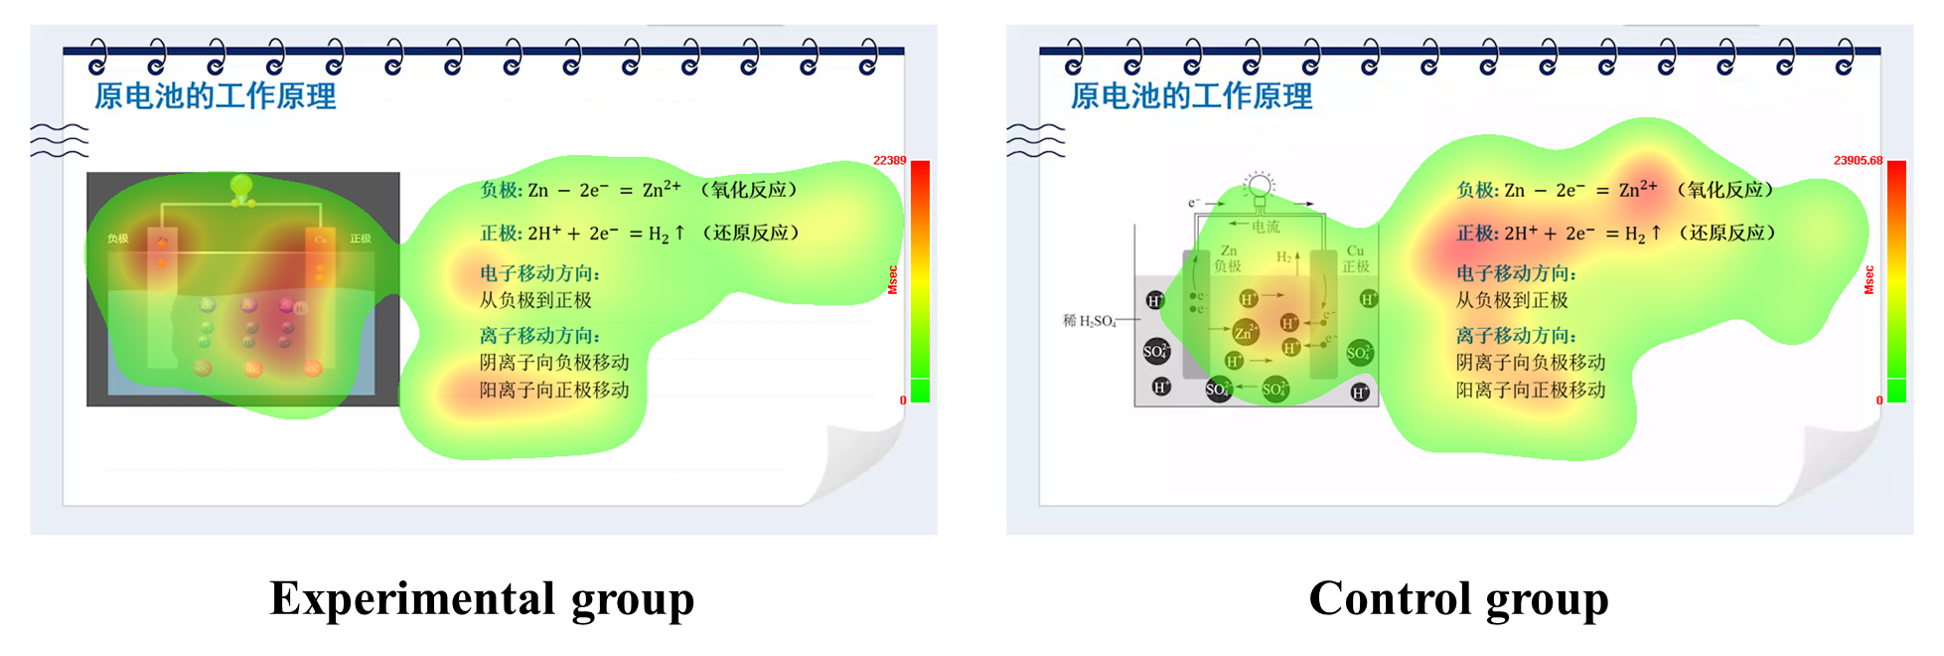
Figure 9 AHeat map of participants in experimental and control group.
4. Discussion
The results showed that the total rankings of the students in the experimental group on the test had been appreciably distinct from those of the students in the control group (p=0.040<0.05). It can be inferred that the participants in the experimental group had a more thorough understanding of the particulate nature of matter than the participants in the control group. It indicates that simulations can help students understand the particulate nature of matter. This is due to the fact that simulation can visualize abstract chemical models and help students advance suitable mental models to understand concepts and processes. This is constant with the findings of preceding studies that simulation leads to better performance and a greater thorough perception of the particulate nature of matter in tests.[17,39,40] A better appreciation of the particulate nature of matter can assist students to better study other scientific concepts in subsequent studies.
This study used an eye-tracking device in order to understand participants' attention allocation in the course of the learning process. The results showed that participants in the experimental group had appreciably more fixations time and the number of fixations to the Particulate Area AOI than students in the control group, and students in the control group had considerably more fixations time and the number of fixations to the Characters Area AOI than participants in the experimental group. It was determined that participants showed deeper cognitive procedures and higher grasp when they experienced longer fixation times.[41] It was shown that participants in the experimental group paid greater interest and deeper cognitive processing to the Particulate Area AOI and would gather extra information from the Particulate Area AOI, while participants in the control group paid more interest and deeper cognitive processing to the Characters Area AOI and would gather greater records from the Characters Area AOI. The analysis of the number of saccades of AOI showed that participants in the experimental group had appreciably fewer saccades of both the Particulate Area AOI and the Characters Area AOI than participants in the control group. This may be due to the fact that the participants in the control group had been more difficult to extract and process relevant information, and would search, localize and combine the Particulate Area AOI and the Characters Area AOI more throughout the learning process, which resulted in more saccades.
This study used both subjective evaluation and physiological measurements to understand the cognitive load of the participants all through the learning process. According to the results of participants' cognitive load scores based on subjective assessment, the experimental group's cognitive load scores had been notably lower than the control group's cognitive load scores (p=0.001<0.01). According to the results of pupil diameter, the size of pupil diameter of the experimental group was appreciably lower than that of the control group (p=0.001<0.01), the alteration of pupil diameter of the experimental group was appreciably lower than that of the control group (p=0.001<0.01). It confirmed that the experimental group's learning had a lower cognitive load throughout gaining knowledge of than the control group. On the one hand, particle visualization has the benefit of supplying participants with views of the conduct and interactions between particles, which are generally abstract and difficult for participants to generate on their own. As compared to pictures, simulation describes the conduct and interactions of particles in a dynamic way, which can reduce the cognitive load of participants through concretizing and visualizing the abstract.[40,42] On the other hand, participants in the control group carried out more searching, localization, and integration of the Particulate Area AOI and the Characters Area AOI, suggesting that participants in the control group had more challenge in extracting and processing relevant information. As a result, a higher cognitive load was created in the learning process.
5. Conclusions
This study investigates the effect of simulation on participants' appreciation of the particulate nature of matter. The results showed that participants in the experimental group had better conceptual understanding. It is shown that the use of simulation could enhance participants' understanding of the particulate nature of matter. Meanwhile, this study used an eye-tracking device to track participants' attention distribution during the learning process. The results showed that participants in the experimental group had more fixation to the Particulate Area AOI, paid more attention to the motion and interaction of particles, and could better understand the particulate nature of matter. Participants in the control group had more fixation on the Characters Area AOI, did not pay sufficient attention to the motion and interactions of the particles, had been harder to extract and procedure the applicable information, and could not understand the particulate nature of matter well. It is shown that simulations can increase students' attention to the particulates, which contributes to better conceptual understanding and reduces cognitive load.
This study additionally has some limitations. Due to time constraints, solely thirty students from an ordinary high school had been selected for this study. At the same time, due to the short duration of the experiment, only one lesson was selected for the experiment during the course of the experiment. Therefore, the study may have distinctiveness and with limitations. In the follow-up study, more students should be randomly selected from more ordinary high schools, and more content should be selected to experiment during the experiment to enhance the persuasiveness of the findings.
Conflicts of Interest
The authors declare no conflict of interest.
Funding
This work was supported by the National Natural Science Foundation of China (NSFC) under grant number [72004166].
Author contributions
Wenhuai Huang: First author, Formal analysis, Software, Visualization, Writing Original Draft. Yinghao Jin: Second author, Investigation, Revising Original Draft. Jianqiang Ye: Third author and Corresponding author, Conceptualization, Methodology, Writing Review.
References
-
X. Liu, K. M. Lesniak. "Students' progression of understanding the matter concept from elementary to high school." Sci. Educ. 2005, 89, 3, 433-450.
-
K. Adbo, K. S. Taber. "Learners’ mental models of the particle nature of matter: A study of 16-year-old Swedish science students." Int. J. Sci. Educ. 2009, 31, 6, 757-786.
-
D. L. Gabel, K. V. Samuel, D. Hunn. "Understanding the particulate nature of matter." J. Chem. Educ. 1987, 64, 8, 695-697.
-
H. Özmen. "A cross-national review of the studies on the particulate nature of matter and related concepts." J. Phys. Chem. Educ. 2013, 5, 2, 81-110.
-
M. Çalik, N. Ültay, H. Bağ, A. Ayas. "Effectiveness of particulate nature of matter (PNM)-based intervention studies in improving academic performance: a meta-analysis study." Chem. Educ. Res. Pract. 2023, 24, 3, 938-955.
-
W. D. Vos, A. H. Verdonk. "The particulate nature of matter in science education and in science." J. Res. Sci. Teach. 1996, 33, 6, 657–664.
-
M. Riaz. "Helping children to understand particulate nature of matter." J. Clin. Endocrinol. Metab. 2004, 36, 2, 56-59.
-
A. Ayas, H. Özmen, M. Çalik. "Students' conceptions of the particulate nature of matter at secondary and tertiary level." Int. J. Sci. Math. Educ. 2010, 8, 1, 165-184.
-
J. C. Hadenfeldt, K. Neumann, S. Bernholt, X. Liu, I. Parchmann. "Students' progression in understanding the matter concept." J. Res. Sci. Teach. 2016, 53, 5, 683-708.
-
S. Novick, J. Nussbaum. "Junior high school pupils' understanding of the particulate nature of matter: an interview study." Sci. Educ. 1978, 62, 3, 273-281.
-
B. Andersson. "Pupil’s Conceptions of Matter and its Transformations (age 12-16)." Stud. Sci. Educ. 1990, 18, 1, 53-85.
-
P. Johnson. "Progression in children's understanding of a 'basic' particle theory: a longitudinal study." Int. J. Sci. Educ. 1998, 20, 4, 393-412.
-
J. C. Hadenfeldt, X. Liu, K. Neumann. "Framing students' progression in understanding matter: a review of previous research." Stud. Sci. Educ. 2014, 50, 2, 181-208.
-
A. H. Haidar, M. R. Abraham. "A comparison of applied and theoretical knowledge of concepts based on the particulate nature of matter." J. Res. Sci. Teach. 1991, 28, 10, 919-938.
-
C. C. Tsai. "Overcoming Eighth Graders' Misconceptions about Microscopic Views of Phase Change: A Study of an Analogy Activity." J. Sci. Educ. Technol. 1998, 8, 1, 83-91.
-
M. B. Nakhleh, A. Samarapungavan, Y. Saglam. "Middle school students' beliefs about matter." J. Res. Sci. Teach. 2005, 42, 5, 581-612.
-
H. Tang, M. R. Abraham. "Effect of Computer Simulations at the Particulate and Macroscopic Levels on Students' Understanding of the Particulate Nature of Matter." J. Chem. Educ. 2016, 93, 1, 31-38.
-
A. H. Johnstone. "The development of chemistry teaching: A changing response to changing demand." J. Chem. Educ. 1993, 70, 9, 701-701.
-
M. J. Sanger, A. J. Phelps, J. Fienhold. "Using a computer animation to improve students' conceptual understanding of a can-crushing demonstration." J. Chem. Educ. 2000, 77, 11, 1517-1520.
-
R. M. Kelly, L. L. Jones. "Investigating students' ability to transfer ideas learned from molecular animations of the dissolution process." J. Chem. Educ. 2008, 85, 2, 303-309.
-
D. M. Bunce, D. Gabel. "Differential effects on the achievement of males and females of teaching the particulate nature of chemistry." J. Res. Sci. Teach. 2002, 39, 10, 911-927.
-
E. J. Yezierski, J. P. Birk. "Misconceptions about the Particulate Nature of Matter. Using Animations to Close the Gender Gap." J. Chem. Educ. 2006, 83, 6, 954-960.
-
H. Özmen, H. Demircioğlu, G. Demircioğlu. "The effects of conceptual change texts accompanied with animations on overcoming 11th grade students' alternative conceptions of chemical bonding." Comput. Educ. 2009, 52, 3, 681-695.
-
V. M. Williamson, M. R. Abraham. "The effects of computer animation on the particulate mental models of college chemistry students." J. Res. Sci. Teach. 1995, 32, 5, 521-534.
-
R. M. Kelly, L. L. Jones. "Exploring How Different Features of Animations of Sodium Chloride Dissolution Affect Students' Explanations." J. Sci. Educ. Technol. 2007, 16, 5, 413-429.
-
M. Stieff. "Improving representational competence using molecular simulations embedded in inquiry activities." J. Res. Sci. Teach. 2011, 48, 10, 1137-1158.
-
E. E. Olakanmi. "The effects of a web-based computer simulation on students' conceptual understanding of rate of reaction and attitude towards chemistry." J. Balt. Sci. Educ. 2015, 14, 5, 627-640.
-
R. D. Sweeder, D. G. Herrington, J. R. VandenPlas. "Supporting students' conceptual understanding of kinetics using screencasts and simulations outside of the classroom." Chem. Educ. Res. Pract. 2019, 20, 4, 685-698.
-
F. N. Finley, J. Stewart, W. L. Yarroch. "Teachers' perceptions of important and difficult science content." Sci. Educ. 1982, 66, 4, 531-538.
-
B. Butts, R. Smith. "What do students perceive as difficult in HSC chemistry." Aust. Sci. Teach. J. 1987, 32, 4, 45-51.
-
H. Schmidt, A. Marohn, A. G. Harrison. "Factors that prevent learning in electrochemistry." J. Res. Sci. Teach. 2007, 44, 2, 258-283.
-
R. E. Mayer, V. K. Sims. "For whom is a picture worth a thousand words? Extensions of a dual-coding theory of multimedia learning." J. Educ. Psychol. 1994, 86, 3, 389-401.
-
F. Paas, A. Renkl, J. Sweller. "Cognitive load theory and instructional design: Recent developments." Educ. Psychol. 2003, 38, 1, 1-4.
-
J. Sweller, J. J. Van Merrienboer, F. G. Paas. "Cognitive Architecture and Instructional Design." Educ. Psychol. Rev. 1998, 10, 3, 251-296.
-
A. J. Sarkin, D. P. Dionisio, W. A. Hillix, E. Granholm. "Positive and negative schizotypal symptoms relate to different aspects of crossover reaction time task performance." Psychiatry Res. 1998, 81, 2, 241-249.
-
M. A. Just, P. A. Carpenter. "A theory of reading: From eye fixations to comprehension." Psychol. Rev. 1980, 87, 4, 329-354.
-
H. Lu, Y. Jiang, H. Bi. "Development of a measurement instrument to assess students' proficiency levels regarding galvanic cells." Chem. Educ. Res. Pract. 2020, 21, 2, 655–667.
-
S. G. Hart, L. E. Staveland. "Development of NASA-TLX (Task Load Index): Results of Empirical and Theoretical Research." Adv. Psychol. 1988, 52, 6, 139-183.
-
H. Wu, J. S. Krajcik, E. Soloway. "Promoting conceptual understanding of chemical representations: Students' use of a visualization tool in the classroom." J. Res. Sci. Teach. 2001, 38, 7, 821-842.
-
J. P. Suits, M. J. Sanger. "Dynamic visualizations in chemistry courses." USA 2013.
-
H. C. She, Y. Z. Chen. "The impact of multimedia effect on science learning: Evidence from eye movements." Comput. Educ. 2009, 53, 4, 1297-1307.
-
W. Schnotz, T. Rasch. "Enabling, facilitating, and inhibiting effects of animations in multimedia learning: Why reduction of cognitive load can have negative results on learning." Educ. Technol. Res. Dev. 2005, 53, 3, 47-58.